Thursday, October 29, 2015

Condo Market Report for Vancouver WA September 2015

Condo Market Running out of Supply in Vancouver for September 2015!

Tidewater Cove Luxury Waterfront Condos in Vancouver WA

 Condos for sale in Vancouver WA (aka Apartments-to-Own) have done so well, especially in terms of Unit-Sales-Volume, we have entered an extreme scarcity of condos available for sale!  Here are the highlights for September2015:

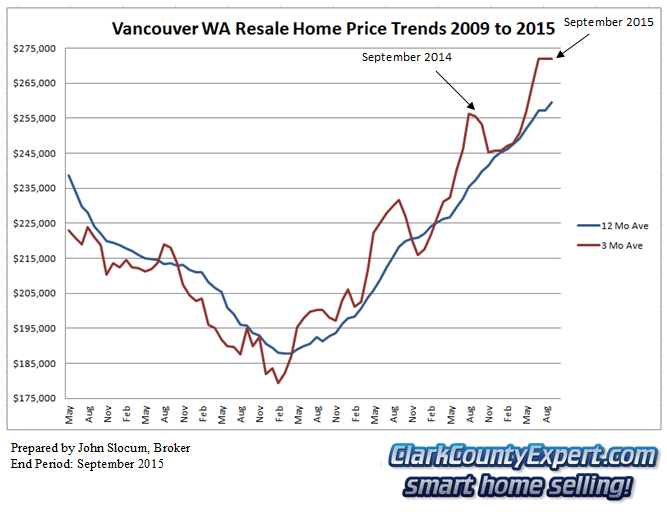
  • Condo Average Sales Prices have actually moved more of a sideways direction, with the 3-Month Moving Average now at $198,428 closing down 0.44% over the prior September; and the 12-Month Moving Average closed up 9.0%
       
  • 50 Resale Condos were sold in September, which is about 17 (-28.3%) Fewer condos than in September 2014;
     
  • REO/Bank Owned Condo sales were 0 units (0.0% of total); down from 11 (16.4% of total) in September 2014.
     
  • Short Sale /Pre-Foreclosure property sales were 1 unit (2.0% of total); compared to 2 (3.0% of total) in September 2014.

Like we have seen for Single-Family Residential (SFR) Homes for sale in Vancouver WA, Condominiums and Attached-Homes have perform very well so far in 2015.  However, the demand has been so great that the available inventory is in extremely short supply currently - at 1.5 months of available inventory!

Our Custom Condo Charts for Vancouver will help tell the story! 

Vancouver Washington Condo Sales September 2015 - Units Sold Vancouver WA Resale Condo Sales - Units Sold Trend September 2015

The units-sold chart (above) is showing the typical seasonal retreat however, since the inventory level is so very low, we suspect there would be much less indicated slowing if there were more condos available for sale!  Is this a trend that suggest more Condo projects need to be built in Vancouver?!   In fact we are seeing new condo or attached homes going in at places like The Lakes Condos; Renaissance at Hiddenbrook Townhomes; Stoneleaf Townhomes; and Erickson Farms.

This month's Average Condo Sales-Prices are slightly contradictory showing an inability for the short-term trend line to surpass the level achieved in 2014.  However, we must remember this is a relatively small market where a sale or two at the luxury end of the market can cause the price-averages to move quite a bit for any particular month/quarter.  It is worth noting that the Long Term trend-line is clearly showing a "Top Formation" with the direction being in a side-ways to slightly downward direction at this time.

Vancouver WA Condo Sales September 2015 - Average Sales Price Trends Vancouver WA Resale Condo Sales - Average Sales Price Trend


The set of RMLS chats below show the most recent twelve (12) months of action - through September 2015, for Unit Sales, Average & Median Prices; and Days on Market:

Charts of Vancouver WA Condo Sales Trends in September 2015 Vancouver Condo Sales Inventory & Days on Market Trends


September's very strong performance is shown in this last trio of charts. With now 5 Months for the Median Days on Market at the sub-20 market.  This is clearly a good time for a Condo Seller to put their home on the market, and a Condo buyer to be one-hundred (100%) percent prepared to make their purchase when that right condo becomes available! 

We hope you found this Vancouver WA Condo Market to be informative.  Please contact us with any questions or comments; and to let us know your selling or buying plans!


PS - Please visit the Condos For Sale in Vancouver WA page at our website, where we have made it Easy to search by Neighborhood for Condos, with listings for condos from the entire RMLS.  You do not have to Sign-up to view Condos!

PPS - Don't wait any longer with your Condo Selling or Buying Plans - Call Us Soon!


The statistical charts for Vancouver WA Condos in this report (prepared by Vancouver WA Realtor® John Slocum, our resident statistician) are based on condo sales recorded in the Vancouver MLS system (RMLS), excluding sales of newly constructed condos; and shows the purchase activity since 2009; charting the 3 month Moving average number of sales, and the 12 month Moving average.  The "smoothing" of the relatively sparse-data helps to better illustrate the short-term and longer term trends in Vancouver's Condo market.

Disclaimer: as with all real estate statistics, we do our best to provide the best representation at the time the data was acquired.  We deem the data and reports reliable but not guaranteed.

Monday, October 26, 2015

Real Estate Market Report for Vancouver WA September 2015

Home Sales Show Seasonal Slowing for September 2015 in Vancouver WA !

The expected evidence of the seasonal peak has made itself clear for the sales data for Vancouver Home Sales for September 2015.  Key stats for this past month:
  • 420 Resale Homes were sold in September 2015, which is 3 (<1%) more homes than had sold in September 2014.
     
  • The Price Trend Lines show the 3-Month Moving Average trending downward, although up 6.34% over the prior year at $271,847; and the 12-Month Moving Average up 9.40%, and now at $259,441.
      
  • Short Sale /Pre-Foreclosure property sales were 13 units (3.1% of total); up slightly from last month; and a substantial positive change compared to 21 (5.04% of total) in September of 2014.
  • REO/Bank Owned home sales were 14 units (3.3% of total); slowing their downward trend compared to 36 (8.6% of total) in September of 2014.
     
  • Inventory for Resale Homes at the end of September has slipped to 1.8 Months! - a Seller's Market that has become more extreme!
The graphical part of our presentation comes with real estate market charts to we have prepared that allow the monthly-reported data to be smoothed into 3-month and 12-month rolling averages.

The Portland/Vancouver metro market area has made national news as being one of the stronger real estate markets in the country; owing to a relatively large in-migration to this area.  This growth appears to reflect itself at this time of the year with the average sales showing more of a "pause" rather than a "retreat."  
Vancouver Washington Resale Home Sales September 2015 - Units Sold Vancouver WA Resale Home Sales - Units Sold Trend September 2015

Although the Unit Sales trend is showing the seasonal slowing, of note this year is the much higher level it has achieved for early Fall - about 10% higher than in the previous two years at this time.    

The chart below is showing Vancouver's Resale Average Home Sales-Prices, and how the flat-top has continued from last month!  When we recall from above that the Inventory level has been reduced from 2+ to 1.8 months, it makes sense there is downward resistance in this price-trend line.
Vancouver WA Resale Home Sales September 2015 - Average Sales Price Trends Vancouver WA Resale Home Sales - Average Sales Price Trend

77 properties (18.3%) were priced $200,000 or less when sold; with 151 (36.0%) sold that were priced $200,000 to $250,000. In comparison, in 2014 there 62.35% of the September sales were at $250k or below; while this September that is now at 54.3%.

From the Regional Multiple Listing Service the charts below show the past twelve-month's of action for Unit Sales, Average & Median Prices; and Days on Market:
RMLS Charts of Vancouver WA Resale Home Sales Trends in September 2015 Vancouver Resale Home Sales Inventory & Days on Market Trends

WOW! - we have now had six straight (6) months where the Median Days on Market are less than 20 days!  The overall Average Days on Market is also at the lowest point for the entire year!


PS - Please visit our Homes  Currently Listed For Sale in Vancouver WA page.  We've made it Easy to search by Neighborhood or by Category, with Homes  and real estate listings from the entire RMLS.  Sign-up Not Required!

Some of the Popular Searches include: Cascade Park Homes; The Heights Homes; Hazel Dell / Lakeshore Homes; Felida Homes; Fishers Landing Homes; Minnehaha / Walnut Grove Homes; And Salmon Creek Homes.


PPS -2015 is breaking records for the Vancouver Washington real estate market.  Do You Have Home Selling or Buying Plans this Autumn Season? - Call Us Right Away!


This report and custom charts (prepared by John Slocum Realtor®, our resident statistician) are based on home sales posted in the Vancouver MLS system (RMLS), excluding sales of mobile home; and shows the purchase activity since 2009; charting the 3 month Moving average number of sales, and the 12 month Moving average.  This "smoothing" of the trend-data helps illustrate the short-term and longer term trends in Vancouver WA's real estate market.

Disclaimer: as with any real estate statistics, we do our best to provide the best representation at the time the data was acquired.  We deem the data and reports reliable but not guaranteed.