Tuesday, February 27, 2018

Historical Perspective on Home Loan Interest Rates

Current Home Loan Rates in the 4% Range are a Bargain for Clark County WA Home Buyers in 2018.

In 1968, mortgage rates were 8.5%. The next year, rates went down to 7%. Homeowners could buy a 15-20% larger home for the same payments if they could find someone to assume their mortgage.Mortgage rate history2a.png
FHA and VA mortgages were very popular in certain price ranges and they allowed anyone to assume the mortgage regardless of the credit. If you could find a person to take over your note, you were free to qualify for another mortgage.
In October 1981, mortgage rates reached 18.63%. A $250,000 mortgage had a monthly principal and interest payment of $3,896.46. As astronomical as that rate sounds, people were still buying homes and were good investments.
Four years later, they were still over 12%. The monthly payment was $2,571.53. Believe it or not, people were excited to be paying only 2/3 what they had to pay a few years earlier.
Fast forward to late 1991 when the rates went below 9% and that same payment was to $2,015.16. At the turn of the 21st century, rates were 8.15% and that made the payment $1,860.62. Not much change in rates during that decade.
If we look around the housing bubble, late 2008, the rates were 6.04% and the payment was $1,505.31. By 2009, mortgage rates had fallen below 5%. The lowest mortgage rate was 3.31% on November 2012 with a payment of $1,096.27.
Rates fluctuated for the next few years until now, and most of the experts are expecting them to be above 5% by the end of 2018.  Rates have increased each week for the last six weeks to 4.38% with payments of $1,240.12.
The average mortgage rate for the past 47 years is a little over 8%. The real estate and mortgage markets are cyclical. Rates have been historically low for a long period but will probably continue to rise. Most buyers don’t pay cash and mortgages enable them to purchase now. Based on history, even 8% would be an excellent rate. Until it reaches that point again, everything lower is a bargain.


PS - This is clearly a great time to List and Sell Your Home with Our Team for 2018; or, at least find out what your home is worth!  We offer a no-cost, no-obligation Clark County WA Home Valuation, and invite you to try it out!

PPS - You are invited to visit our web-page for Clark County WA  Homes For Sale where it is Quite Easy to search by City, Neighborhood or by Category, with homes and real estate listings from the entire RMLS.  Sign-up Not Required!  The property and home listings shown are provided via many updates each day, and you will be e-mailed hourly with any new matches once you've signed up for a home search.

We also have the MLS Listings for these great towns in Clark County:  Battle Ground WA Real Estate | Brush Prairie WA Homes | Camas WA Real Estate | Hockinson WA Homes | La Center WA Homes | Ridgefield WA Homes | Vancouver WA Homes | Washougal WA Real Estate | Yacolt WA Homes | Amboy WA Homes


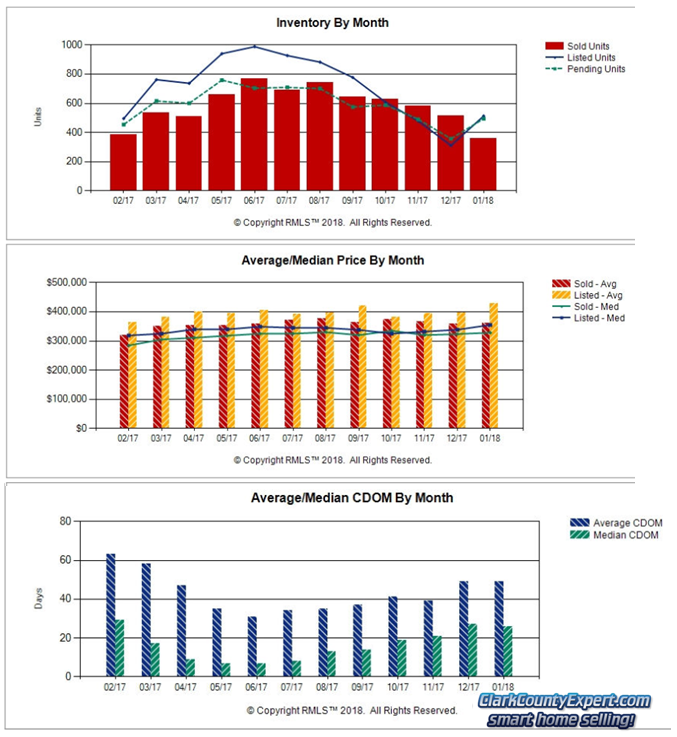
The information and charts in this Clark County WA real estate update are provided by Vancouver WA Realtor, John Slocum, CRS, SFR.

Disclaimer: as with any real estate statistics, we do our best to provide the best representation at the time the data was acquired and compiled.  The data and reports are deemed reliable but not guaranteed.

Thursday, February 22, 2018

Clark County WA Real Estate and Home Sales - January 2018 Market Report

Slight Drop in Pre-Owned Home Sales in Clark County WA for January 2018.

Starting the new year for Clark County pre-owned real estate and home sales we've tallied just 37 fewer units-sold for January. Here are some of the highlights for January's results: 

  • Average-Sales Prices have fallen slightly from recent record highs, as we'd expect this time of year; the 12-month/long-term trend line is up 10.66% compared to January 2017,  and the 3-Month Moving Average is up 12.48% from last year; 
     
  • The Inventory for Resale Homes continues falling and is now at a low 1.0 Months Supply;
     
  • Approximately 360 Resale Homes were sold in the month, which is about 37 fewer (-9.3%) homes than in 2017; and 156 fewer than last month.
     
  • REO/Bank Owned property sales were 0 units (0% of total); down from 1 (0.3%) in 2017. 
     
  • Short Sale /Pre-Foreclosure property sales were 0 units (0% of total); down from 1 (0.3%) in 2017.

The month-end, 30-year-fixed home loan benchmark interest rate is 4.03% (up from 3.95% last month) according to Freddie Mac; compared to 4.15% for January 2017.

Moving on to our custom graphs/charts for Clark County WA. We employ a simple "smoothing" technique to better present the short-term trend (3-month moving average in Red); and long-term trend (12-month moving average in Blue). 

Clark County Home Sales January 2018- Units Sold Clark County Home Sales - Units Sold Trend January 2018

The seasonally-declining short-term trend-line is now well below the longer-term trend-line, as expected in the Winter season. The long-term line is showing a slight wiggle upwards; which tends to counter the news stories that we are seeing a big drop in home sales.

Average Sales prices (shown in the chart below) are continuing their ever-so-slight decline, which is a much more moderate decline that we usually see this time of year; with the long-term trend showing little hesitation on its run upwards. 

Clark County Home Sales January 2018- Average Sales Price Trends Clark County Home Sales - Average Sales Price Trend January 2018


The January short term Average sales price for Clark County is now up to $362,053. This is an increase of about $40,180 from a year ago.


Charts of Vancouver WA Home Sales Trends in January 2018 Clark County Home Sales Inventory
& Days on Market - January 2018


These final three graphs from RMLS show:

Pending and New Listings have taken an unusually strong jump upwards early this year, with Closed sales obviously lagging behind. We should the Closed Sales tally to move up strongly in the immediate coming months. 

The second graph is posting the average list price at its highest level in the past 12 months; leaving little doubt as to where home sellers think prices are going.

Finally, for the Days on the Market, the Average stayed the same at 49 and Median dropped one day to 26.

More information from the RMLS published report on the Clark County real estate scene can be found here: RMLS Market Action Report on our website.


PS - This is clearly a great time to List and Sell Your Home with Our Team for 2018; or, at least find out what your home is worth!  We offer a no-cost, no-obligation Clark County WA Home Valuation, and invite you to try it out!

PPS - You are invited to visit our web-page for Clark County WA  Homes For Sale where it is Quite Easy to search by City, Neighborhood or by Category, with homes and real estate listings from the entire RMLS.  Sign-up Not Required!  The property and home listings shown are provided via many updates each day, and you will be e-mailed hourly with any new matches once you've signed up for a home search.

We also have the MLS Listings for these great towns in Clark County:  Battle Ground WA Real Estate | Brush Prairie WA Homes | Camas WA Real Estate | Hockinson WA Homes | La Center WA Homes | Ridgefield WA Homes | Vancouver WA Homes | Washougal WA Real Estate | Yacolt WA Homes | Amboy WA Homes


The information and charts in this Clark County WA real estate update (prepared by Vancouver WA Realtor, John Slocum, CRS, SFR, our resident statistician) are based on home sales recorded in the Clark County WA MLS system (RMLS), excluding sales of mobile home; and shows the purchase activity since 2009; charting the 3 month Moving average number of sales, and the 12 month Moving average.  This "smoothing" of the trend-data helps illustrate the short-term and longer term trends in Clark County's real estate market.

Disclaimer: as with any real estate statistics, we do our best to provide the best representation at the time the data was acquired and compiled.  The data and reports are deemed reliable but not guaranteed.