Strong Real Estate Sales Results for Clark County WA in November 2019.
- Average-Sales Price slipped about $500 to $404,034, with the 12-month/long-term
trend line up 3.73% year-over-year; with the 3-Month Moving Average up
3.4% from this time last year (up a small amount from last month);
- The Inventory for Resale Real Estate slipped 0.4 months to a much lower 1.3 Months
of Supply;
- Approximately 526 Resale Properties closed in the month, which is about 30
more (6.05%) homes than in 2018; and 58 fewer than last month;
- REO/Bank Owned property sales were 5 units (0.95% of total); down from 3 (0.6%) in 2018;
- Short Sale /Pre-Foreclosure property sales were 1 unit (0.19% of total); up from 0 (0%) in 2018.
My custom chart below for Unit-Volume (number of properties sold) that shows the short term (in Red) and long term (12-month moving average in Blue) trends:
 Clark County Home Sales - Units Sold Trend November 2019
Next we have the Average Home Sales Price trend-chart, highlighting the current and historical Home-Sales-Price results in both short-term and long-term:
 Clark County
Home Sales - Average Sales Price Trend
November 2019
Clark County
Home Sales - Average Sales Price Trend
November 2019The Average Sales Price (using 3 months) for Clark County is now $404,034; which is an increase of approximately $14,522 from this time last year.
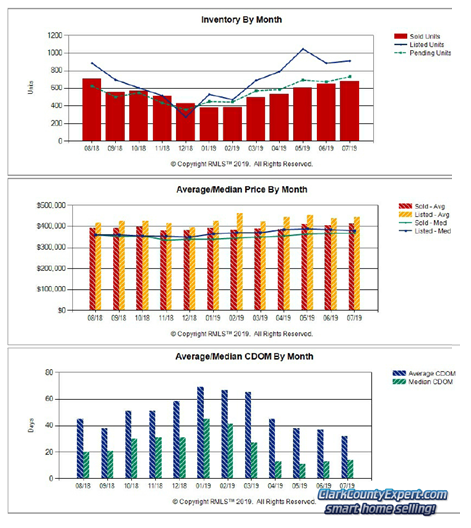
The final charts for this report come from RMLS and show:
 Clark County
Home Sales Inventory
Clark County
Home Sales Inventory
& Days on Market - November 2019
New Listings aren't keeping up with Pending Sales and Closed Sales, even though all moved lower; causing the level of Active Inventory to shrink quite a bit.
The second graph shows both Average List prices coming in quite strong again, while Sales Prices were at a high level as well.
Finally, Average Days on Market and Median Days on the Market moved upwards by a few days each.
You will also find posted the recent RMLS published report on the Clark County real estate market here: RMLS Market Action Report on our main website.
Thank you for visiting our Real Estate Sales report for Clark County WA. Please let us know if you have any questions or need help with your home or condo!
PS - The real estate market is changing, prices are
softer with loan costs presently at very low levels, keeping this an excellent time to List and Sell Your
Property with Our
Team; or, at least find
out what your property is worth! We offer a no-cost, no-obligation
Clark County WA Home Valuation, and invite you to try it out!
PPS - Looking to buy a property reasonably soon? Interest rates are still at historically low rates. You are invited to visit our web-page for Clark County WA Homes For Sale where it is Quite Easy to search by City, Neighborhood or by Category, with homes and real estate listings from the entire RMLS. Sign-up Not Required! The property and home listings shown are provided via many updates each day, and you will be e-mailed hourly with any new matches once you've signed up for a home search.
We also have the MLS Listings for these great towns in Clark County: Battle Ground WA Real Estate For Sale | Brush Prairie WA Homes For Sale | Camas WA Homes for Sale | Hockinson WA Homes For Sale | La Center WA Homes for sale | Ridgefield WA Homes for sale | Real Estate for sale in Vancouver Washington | Washougal WA Real Estate | Yacolt WA Homes For Sale | Amboy WA Homes For Sale
The information and charts in this Clark County WA real estate update (prepared by Vancouver WA Home Sales Broker, John Slocum, CRS, SFR, our resident statistician) are based on home sales recorded in the Clark County WA MLS system (RMLS), excluding sales of mobile home; and shows the purchase activity since 2009; charting the 3 month Moving average number of sales, and the 12 month Moving average. This "smoothing" of the trend-data helps illustrate the short-term and longer term trends in Clark County's real estate market.
Disclaimer: as with any real estate statistics, we do our best to provide the best representation at the time the data was acquired and compiled. The data and reports are deemed reliable but not guaranteed.