Vancouver's Condo Market Going Strong in July 2015!
Condos
for sale in Vancouver WA (aka Apartments-to-Own)
are doing extremely well for improvement in both Unit-Sales-Volume, and Average
Sales Price. Here are the highlights for July 2015:
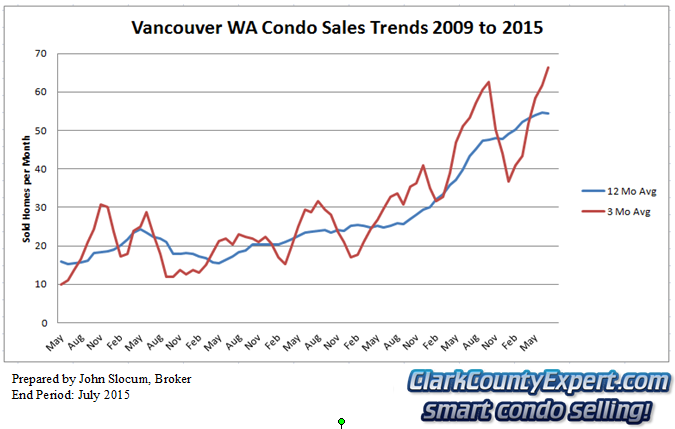
- Condo Average Sales Prices have moved up strongly, with the 3-Month Moving Average
now at $201,790
closing up 14.9% over the prior July; and the 12-Month Moving Average closed up
18.5%
- 75 Resale Condos were sold in July, which is about 23
(44.2%) more condos than in July 2014;
- REO/Bank Owned Condo sales were 5 units (6.7% of total); up from 3
(5.8% of total) in July 2014.
- Short Sale /Pre-Foreclosure property sales were 2 units (1.7% of total); compared to 4 (7.7% of total) in July 2014.
Similar to
SFR Homes for sale in Vancouver WA, Condos and Attached-Homes have seen a
very strong increase in unit-volume however, this group's average price increase
is at almost twice the rate! We continue to see the Distressed-property segment for Condos
shrinking, getting closer to more traditional low-levels.
Next we'd like
to share our Custom Charts for Vancouver Condos!
 Vancouver WA Resale Condo Sales - Units Sold Trend July 2015
The chart above for condo units-sold shows we are clearly in record
territory, with the monthly average above 50 units (long-term) and close to 70
for the summer season! If this year's pattern follows that of last year,
we may be near the peak for the year in terms of number of condos sold.
July's results for Average Condo Sales-Prices also show we are in record-setting
territory, with the 3-month moving
average line (in red) still strongly upward. Again, as we are near the end
of the summer, we may see average sales prices start to moderate somewhat.
 Vancouver WA Resale Condo Sales - Average Sales Price Trend
The set of RMLS chats below show the month-by-month action - through
July 2015, for
Unit Sales, Average & Median Prices; and Days on Market:
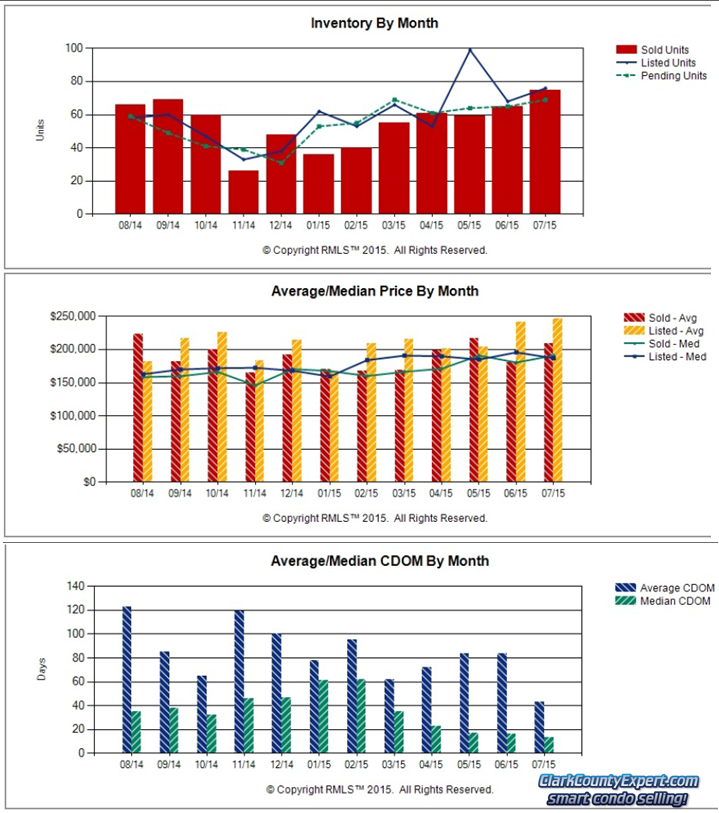 Vancouver Condo Sales Inventory & Days on Market Trends
July's very strong performance is shown in this last trio of charts. With
3 Months for the Median Days on Market below 20 - condo buyers must be ready to
act quickly when a new listing comes out! RMLS is showing the Inventory level for Vancouver Condos at 1.7
months - which is still an extreme Seller's
Market level.
Thank you for taking the time to learn more about the Condo Market
in Vancouver Washington. You are invited to contact us
with any questions or comments; and to let us know your selling or buying plans!
PS - Please visit the
Condos For Sale in Vancouver WA page at our website, where we have made it Easy to search
by
Neighborhood for Condos, with listings for condos from the entire
RMLS. You do not have to Sign-up to view Condos!
PPS - Don't
wait any longer with your
Condo Selling or Buying Plans - Call Us Soon!
The statistical charts for Vancouver WA Condos in this report (prepared by
Vancouver WA Realtor® John Slocum, our resident statistician) are based on
condo sales recorded in the Vancouver MLS system (RMLS), excluding sales of
newly constructed condos; and shows the purchase activity since 2009; charting the 3 month Moving average number of sales, and the 12 month Moving average. The "smoothing" of the
relatively sparse-data helps to better illustrate the short-term and longer term trends in
Vancouver's Condo market.
Disclaimer: as with all real estate statistics, we do our best to provide the best representation at the time the data was acquired. We deem the data and reports reliable but not guaranteed.
No comments:
Post a Comment