Improving Inventory with Continued Rising Prices for Clark County WA's Real Estate Market.
Clark County's real estate market has hit the peak for the season, while still relatively strong. Inventory is still low but improving, with Sales Prices at record high levels. Here are some of the highlights for July's results:
- Average-Sales Prices are at record highs, with the 12-month/long-term
trend line up 11.01% compared to July 2016, and the 3-Month Moving Average
is up
11.18% from last year;
- The Inventory for Resale Homes has slowly improved and is now at a still-low 1.8 Months Supply;
- Approximately 639 Resale Homes were sold in the month, which is about
7 fewer (-1.1%) homes than in 2016.
- REO/Bank Owned property sales were 5 units (0.8% of total); down from
18 (2.8%) in 2016.
- Short Sale /Pre-Foreclosure property sales were 5 units (0.8% of total); down from 9 (1.4%) in 2016.
The month-end, 30-year-fixed home loan benchmark interest rate is 3.97% (down
from 3.9% last month) according to Freddie Mac; compared to 3.44% for July 2016.
We have created our own graphs/charts for Clark County WA that will help tell the
rest of this real estate market's story.
A simple "smoothing" technique to better present the short-term trend
(3-month moving average in Red); and long-term trend (12-month moving average in
Blue).
 Clark County Home Sales - Units Sold Trend July 2017
This is the time of the season that we see the short-term trend-line hit its
peak. This year we'll see if that takes place in July or in August. The
long-term line is at a lower level than last year, as there have been about 129
fewer sales this year compared to last.
For the next chart: Average Sales prices (shown below)
are still on the upswing, as the number of active home-buyers is still
out-matching supply.
 Clark County Home Sales - Average Sales Price Trend
July 2017
Clark County Home Sales - Average Sales Price Trend
July 2017
The
July short term Average sales price for Clark County is now up to $360,496. This is an increase of about $36,238 from the same month last year.
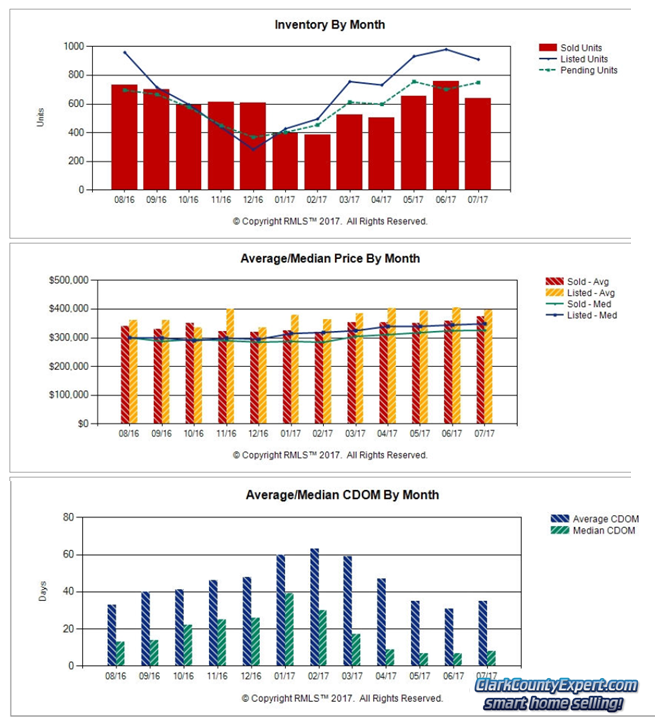 Clark County Home Sales Inventory
& Days on Market - July 2017
These final graphs from RMLS show:
A slight up-tick in Pending
Sales, combined with a decrease in new Listings caused the slowing of the change
in the level of Inventory.
The second graph shows the continued up-side gap comparing the average price of new
listings with the actual closed-sales-prices.
Finally,
for the Days on the Market, the Average has begun its typical upward rise, while
the Median is in a very, very low range.
More information
from the RMLS published report on
the Clark County real estate scene can be found here:
RMLS Market Action Report on our website.
PS - There is Still Time to Sell Your Home in 2017; or, at least find
out what your home is worth! We offer a no-cost, no-obligation
Clark County WA Home Valuation, and invite you to try it out!
PPS - You are invited to visit our web-page for
Clark County WA Homes For Sale where it is Quite Easy to search by City,
Neighborhood or by Category, with homes and real estate listings from the entire
RMLS. Sign-up Not Required! The property and home listings shown are
provided via many updates each day, and you will be e-mailed hourly with any new
matches once you've signed up for a home search.
We also have the MLS
Listings for these great towns in Clark County:
Battle Ground WA Homes |
Brush Prairie WA Homes |
Camas WA Homes |
Hockinson WA Homes |
La Center WA Homes |
Ridgefield WA Homes |
Vancouver WA Homes |
Washougal WA Homes |
Yacolt WA Homes |
Amboy WA Homes
The information and charts in this Clark County WA real estate update (prepared by
Vancouver WA Realtor, John Slocum, CRS, SFR, our resident statistician) are based on home sales recorded in the
Clark County WA MLS system (RMLS), excluding sales of mobile home; and shows the purchase activity since 2009; charting the 3 month Moving average number of sales, and the 12 month Moving average. This "smoothing" of the trend-data helps illustrate the short-term and longer term trends in Clark County's real estate market.
Disclaimer: as with any real estate statistics, we do our best to provide the best representation at the time the data was acquired
and compiled. The data and reports are deemed reliable but not guaranteed.
No comments:
Post a Comment