Real Estate Going Strong in May 2015 for Vancouver WA !
- Approximately 387 Resale Homes were sold in May 2015, which is about 44 (12.8%)
more homes than had sold in May 2014.
- The Price Trend Lines are both very strong, with the 3-Month Moving Average
up 7.12% at $257,073; and the 12-Month Moving Average strongly up 11.2%, and now at
$252,028.
- Short Sale /Pre-Foreclosure property sales were 22 units (5.7% of total); up slightly from last month; but, still trending down when compared to 28 (8.1% of total) in May of 2014.
- REO/Bank Owned home sales were 31 units (8.0% of total); and
continuing the
downward trend when compared to 40 (11.6% of total) in May of 2014.
- Inventory for Resale Homes at the end of May was at 1.8 Months! - no change from last month!
The Quantity (Unit-Sales) of Resale Homes sold in April (Excludes New Construction) are the first to be shown. We use the simple method of statistical smoothing to show the short term trend line -- the 3-month Moving Average; and the longer term trend line -- the 12-month Moving Average.
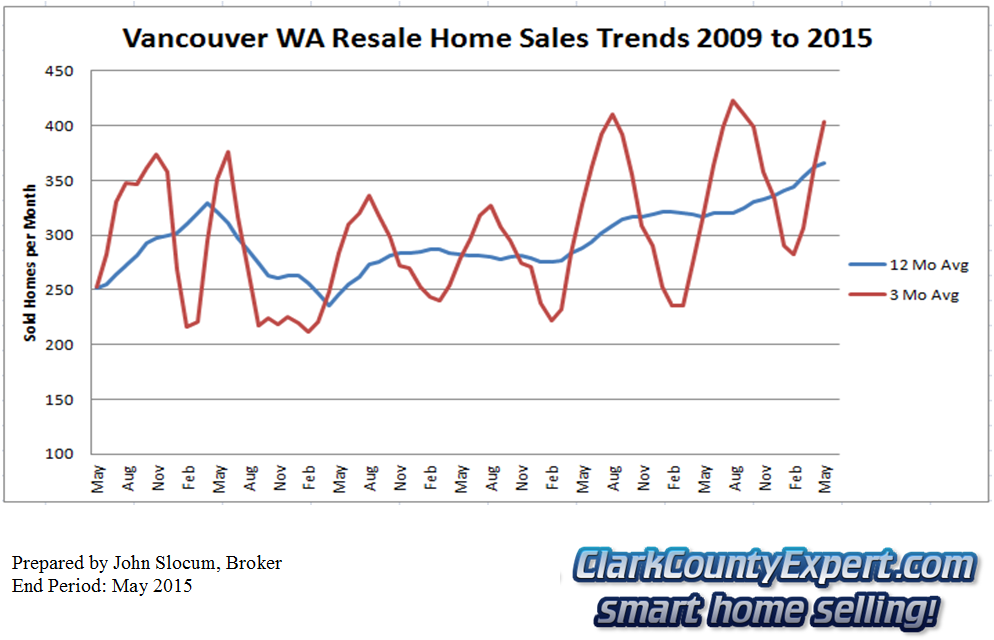 Vancouver WA Resale Home Sales - Units Sold Trend May 2015
Vancouver's Resale Home Prices for May 2015 are increasing their upward trend, as the chart below shows.
 Vancouver WA Resale Home Sales - Average Sales Price Trend
These chats below are from RMLS showing the most recent twelve-month's of action for Unit Sales, Average & Median Prices; and Days on Market:
 Vancouver Resale Home Sales Inventory & Days on Market Trends
Median Days on Market went a second month in the sub-20 Days range, confirming that this is a Hot Real Estate Market!
PS - You are invited to visit our
Vancouver WA Homes For Sale page. We've made it is Easy to search by
Neighborhood or by Category, with Homes and real estate listings from the entire
RMLS. Sign-up Not Required!
PPS -2015 is on fire for the Vancouver Washington real estate market. Do You Have Home Selling or Buying Plans this year? - Call Us Right Away!
PPS -2015 is on fire for the Vancouver Washington real estate market. Do You Have Home Selling or Buying Plans this year? - Call Us Right Away!
The custom charts in this report (prepared by John Slocum Realtor®, our resident statistician) are based on home sales posted in the Vancouver MLS system (RMLS), excluding sales of mobile home; and shows the purchase activity since 2009; charting the 3 month Moving average number of sales, and the 12 month Moving average. This "smoothing" of the trend-data helps illustrate the short-term and longer term trends in Vancouver WA's real estate market.
Disclaimer: as with any real estate statistics, we do our best to provide the best representation at the time the data was acquired. We deem the data and reports reliable but not guaranteed.
No comments:
Post a Comment