Thursday, December 29, 2011

Home Affordability in Vancouver WA at Record High Level for Q3 2011

One of the "Gifts" the current real estate downturn has given us in Vancouver Washington and Clark County, is that the Home Affordability Index (HAI) is at a very high level.  In fact, the data provided by the Washington State University's Washington Center for Real Estate Research (WCRER) shows we are at a High not seen in at least two decades!

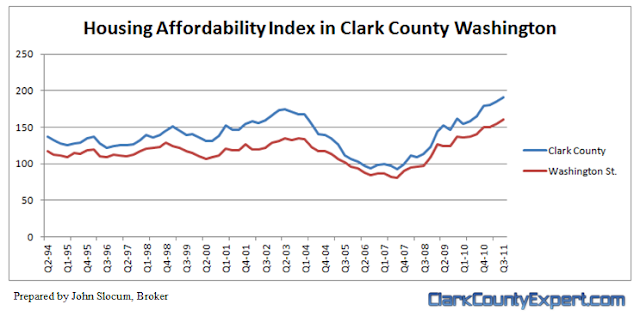
The Quarterly Report prepared prepared by WCRER (Third Quarter 2011 Report can be seen --> Here) is an accumulation of data by County within Washington State, allowing us here in Clark County to see how our real estate market has tracked over time; and to see how we compare to other Counties and the State Average.  The public report is only in tabular form for any given quarter, and we thought it would be informative to prepare a graph, visually showing over time just how amazing the current position is.  The resulting chart below starts with the Second Quarter in 1994 through the Third Quarter of 2011:

Reading the Chart: The Housing Affordability Index (HAI) measures the ability of the Median Household Income (as currently reported by the US Census Bureau) for Clark County to purchase a Median Priced Clark County Home.  The home purchase will be made with a 20% down-payment at the current rate of interest.  A benchmark number of 100 means that the Median Household Income equally matches the requirement to purchase a Median Priced home.  Numbers above 100 mean improved Affordability; while numbers below 100 indicate decreased Affordability.

For the current heights of the HAI, we know that soft home prices and falling home loan rates have weighed in significantly.  On the Household Income measure, apparently Clark County on whole, has not had enough of a drop in income to keep the HAI from rising up.

As we can see the most recent peak in the HAI was at the time of the previous housing recession in the early 2000's.  Once that recovery turned to Boom, and then on to Bubble, the HAI dropped to it's lowest level.  Of note, even at the peak of the Bubble, the HAI for Clark County was just under the 100 benchmark level.

A Word to Wise Home Buyers: we do not expect Clark County and Vancouver WA Homes and Houses to be any more affordable than they are right now!  We've already started seeing home prices firm up, and no one expects home loan interest rates to stay below 4%.  Clark County is also more affordable than most other metro areas in Washington; and we are seeing inbound moves from the Seattle area, for example, as they take advantage of such a move!

We'd love to hear your questions or comments on this topic!

-----
The above information was assembled from data provided by the WSU Washington Center for Real Estate Research, and is deemed reliable but not guaranteed.  The chart was created by John Slocum, Broker with Vancouver WA REMAX using this data.
Wednesday, December 21, 2011

Real Estate and Home Sales Report for Clark County WA October 2011

Real Estate and Home Sales for Clark County Cool (just slightly!) for October 2011

The Autumn Season is here, and  Home Sales and real estate in Vancouver WA and Clark County cooled; Closed Volume slipped below 400 units, with the 3-month rolling average sales price turning lower again. On the positive note, Pending Sales are very strong - just under 500 units. With the strength of the Pending Sales, along with the high level of home refinancing activity occurring (to be sure, the ~4% home loan rates are causing a Refi Boom!),we see it is highly likely some of the closings that may have made it by the end of October instead, got pushed into early November.

We've previously noted the impacts to home sales in 2010 caused by the Federal Home Buyer Tax Credit -- the first half of 2010 Boomed; while the second half collapsed. The positive elements for the 2011 home buying rally have been much lower home loan rates, combined with lower home prices. Thus, Affordability for Homes in Vancouver WA is at a 25+ year high!

Now, on to our report. This information is based on home sales entered into the Vancouver MLS system (RMLS), and exclude sales of mobile homes.

For the first 10 months of 2011 we show 4,084 closed sales; compared to 4,047 for the same period in 2010. If this trend continues for the last 2 months of 2011 (and it should), we expect that 2011 will post a measurably higher sales volume what was recorded for real estate sales in 2011.

The Chart Below (prepared by John Slocum of REMAX Vancouver WA, our resident statistician) shows the purchase activity since 2009; charting the 3 month rolling average of sales, and the 12 month rolling average. This simple "smoothing" of the data better helps illiustrate the short-term and longer term trends in the Clark Conuty homes / real estate market.
Vancouver WA and Clark County Home Sales Volume Trends

The next chart below shows the Average home sales price trends (3 month and 12 month) for the same time period. As you can see, with the extended higher level of purchasing activity we are seeing some support for home sales prices, while the outlook is still "soft."
Vancouver WA Home Sales Price Trends

Lastly, the Level of Available Inventory is an important indicator of market health. We have found that a very high percentage of the "New" homes listing in the MLS are merely prospective homes to be built and thus, we have no good way to scrub out the phantom homes from the actual finished or near-finished product. Therefore, in search of a meaningful Inventory Statistic, we run the report excluding homes built in 2011. The result is our best approximation of a Resold Home Inventory calculation of 5.6 months -- a number that is substantially lower than last year, and another indication that home prices could rise with a continued higher level of demand. In contrast, the RMLS is using a a number drawing from the "New" home segment, and showing a total Inventory of 7.2 months. Clearly, removing the "new homes" that don't truly exist from our analysis provides a better reporting of this statistic.

Charts: For the enthusiasts that like to examine charts, we have the sales results for the Resold Inventory (excludes new homes) by Community that you may find helpful:

Clark County WA Home Sales Results and Charts
Battle Ground WA Home Sales Results and Charts
Camas WA Home Sales Results and Charts
La Center WA Home Sales Results and Charts
Ridgefield WA Home Sales Results and Charts
Vancouver WA Home Sales Results and Charts
Washougal WA Home Sales Results and Charts

Please let us know if you have any specific questions or comments!

Disclaimer: as with any real estate statistics, we do our best to provide the best representation at the time the data was acquired. We deem the data and reports reliable but not guaranteed.