Thursday, December 17, 2015

Vancouver WA Real Estate Market Report November 2015

Resale Home Inventory Shrinks Again in November 2015 for Vancouver WA !

Pressure on Sales-prices continued as the available supply of resale (pre-owned) homes shrinks to an extremely low level for Vancouver WA in November 2015.  Key elements to review for this past month:
  • 308 Resale Homes were sold in November 2015, which is 15 (5.1%) more homes than had sold in November 2014.
     
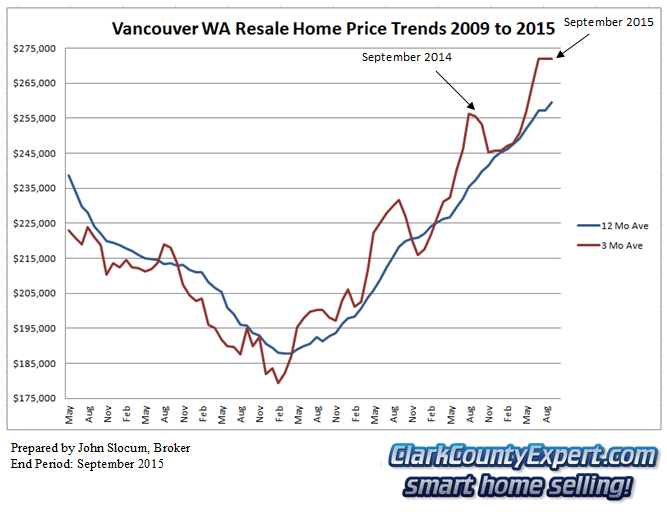
  • The Price Trend Lines show the 3-Month Moving Average reversing direction and trending upward again! - now up 10.92% over the prior year at $271,893; and the 12-Month Moving Average up 9.13%, and now at $263,610.
      
  • Short Sale /Pre-Foreclosure property sales were 7 units (2.27% of total); up 1 unit from last month; and a big decrease when compared to 17 (5.8% of total) in November of 2014.
  • REO/Bank Owned home sales were 13 units (4.2% of total); similar to last month but a nice decrease when compared to 31 (10.6% of total) in November of 2014.
     
  • Available Inventory for Resale Homes at the end of November has been reduced again and is now at 1.3 Months from 1.5 last month!
This local real estate market is still very much in the extreme end of the Seller's Market spectrum; as the nation-wide available inventory for resale homes is at 4.8 months (slightly into a seller's market) while Vancouver WA is currently at 1.3 months!  With our market in such an out-of-balance condition, the typical seasonal "decrease" in the average sales price is under severe pressure!

The charts below show how far Vancouver's market for Existing Homes has improved since 2009.  
Vancouver Washington Resale Home Sales November 2015 - Units Sold 
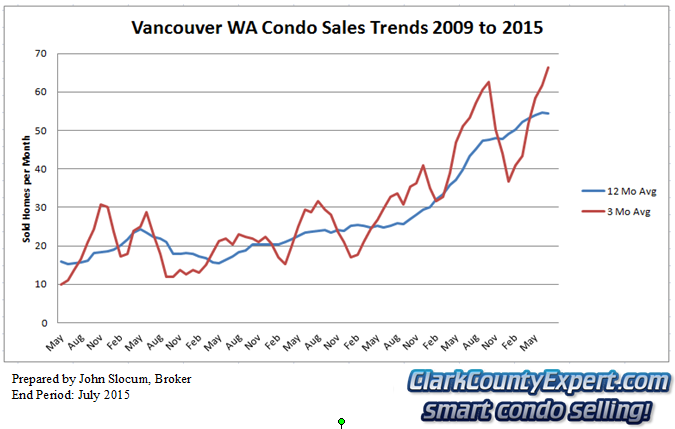
Vancouver WA Resale Home Sales - Units Sold Trend November 2015

The above chart for Units-Sold clearly show the increased level of activity for the past 12+ months.  The seasonal pattern is still evident in the 3-month line however, the turning-points have been much higher than in previous years.  For the year-to-date volume we are 738 homes (19.9%) above 2014's volume!   

Continuing with the chart below, one of the not-so-surprising results of the low inventory is slight up-tick for the short-term average sales price - which would typically be trending downward at this time of the year.  The long-term trend line is continuing upward at about the same rate of increase (positive slope) that it has show for the past three years.
Vancouver WA Resale Home Sales November 2015 - Average Sales Price Trends Vancouver WA Resale Home Sales - Average Sales Price Trend

58 properties (18.8%) closed at $200,000 or less when sold; with 97 (31.5%) sold that were priced $200,000 to $250,000. In comparison with the 2014 measurement, 62.8% of the November sales were at $250k or below; while this November that reading is now at 50.3%.

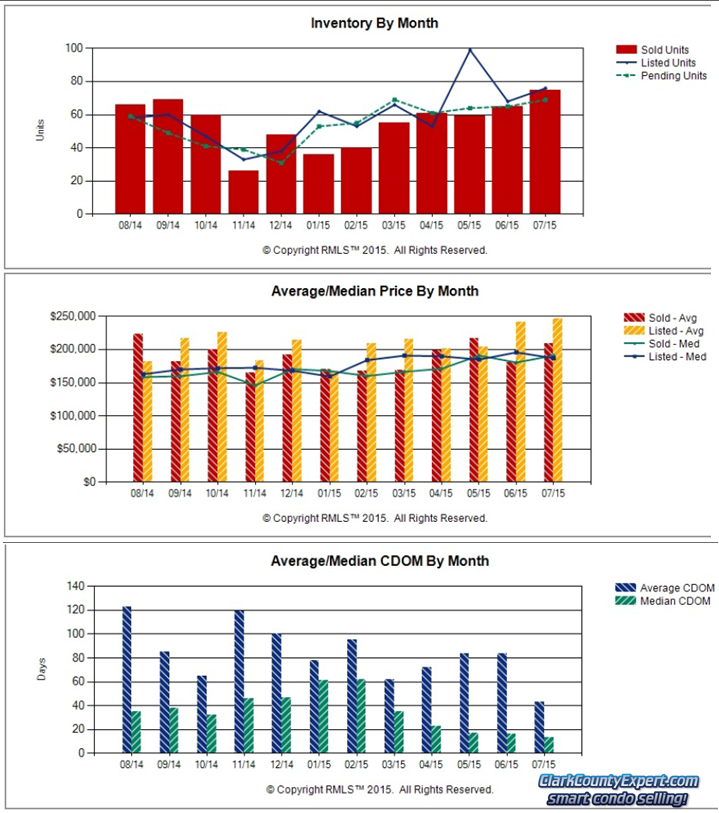
Finally, we have three charts (below) from the Regional Multiple Listing Service showing the recent real estate market action for Unit Sales, Average & Median Prices; and Days on Market:
RMLS Charts of Vancouver WA Resale Home Sales Trends in November 2015 Vancouver Resale Home Sales Inventory & Days on Market Trends

The string of seven (7) straight months has been broken where the Median Days on Market were less than 20 days; although the November results show a much quicker turn-around in market times than what we would expect to see for November.

Thank you for viewing our report, and please contact us with any questions, comments or requests for assistance.

PS - Please visit our Homes  Listed For Sale in Vancouver WA page.  We've made it Easy to search by Neighborhood or by Category, with Homes  and real estate listings from the entire RMLS.  Sign-up Not Required!

Some of the Popular Searches include:  Felida Homes; Fishers Landing Homes; Cascade Park Homes; The Heights Homes; Hazel Dell / Lakeshore Homes; Minnehaha / Walnut Grove Homes; And Salmon Creek Homes.

A few of the Category searches include: Foreclosures Vancouver WA; Vancouver WA Short Sale Listing Agents; Lots and Land for sale in Vancouver WA.

PPS -2015 has broken records for the Vancouver Washington real estate market.  Do You Have Home Selling or Buying Plans this Autumn/Winter Season? - Call Us Right Away!


This report and custom charts (prepared by John Slocum Realtor®, our resident statistician) are based on home sales posted in the Vancouver MLS system (RMLS), excluding sales of mobile home; and shows the purchase activity since 2009; charting the 3 month Moving average number of sales, and the 12 month Moving average.  This "smoothing" of the trend-data helps illustrate the short-term and longer term trends in Vancouver WA's real estate market.

Disclaimer: as with any real estate statistics, we do our best to provide the best representation at the time the data was acquired.  We deem the data and reports reliable but not guaranteed.

Tuesday, December 8, 2015

Battle Ground WA Real Estate Market Report October 2015

Seasonal Slowdown has Commenced for Real Estate in Battle Ground in October 2015!

Located just north of Vancouver we have  Battle Ground WA Home Sales turning in very good results in 2015; although it is now showing signs of the typical slowing at this time of the year. These are some of the key points for October 2015:
  • The 3-Month Moving Average for Average Sales-Price has made an atypical turn upwards, and for the year is up 6.76% from the previous year; while the 12-Month Moving Average meandered and is now only 2.17% higher than at the same time in 2014.
     
  • The Inventory level for Resale Homes declined again and is at 1.8 Months (2.7 in May '15) - Clearly a "Seller's Market"
     
  • Approximately 53 Resale Homes closed in October 2015, compared to 58 Sold in October 2014; a decrease of 5 homes or, -8.6%.
     
  • REO/Bank Owned property sales were 2 units (3.8% of total); compared to 5 (8.6%) in October 2014. 
     
  • Short Sale /Pre-Foreclosure property sales were 1 unit (1.9% of total); compared to 3 (5.2%) in 2014.
Battle Ground is a smaller but growing market area in Clark County WA, and growing so much that the available inventory keeps shrinking each month!  As with smaller markets, the charts we prepare and discuss will likely possess greater variability or, show trends that aren't as smooth as a larger market, such as Vancouver WA.  Never the less, the evidence of short term and longer term trends will be clearly evident in our charts below.

This first chart is showing the number of Homes/Units Sold (Excludes New Construction), with the short term trend line (in Red) calculating the 3-Month Moving Average; and the long term trend line (Blue line) showing the 12-month Moving Average.

Battle Ground Resale Home Sales October 2015 - Units Sold Battle Ground Resale Home Sales - Units Sold Trend October 2015

Battle Ground is performing similar to Clark County this year with a moderately strong increase for Unit-Sales volume, as the above chart clearly shows. Slightly different this month however, is that the sales volume is showing a slight upward tick, as we know home buyers are still very much active in this popular market area.

Curiously, the "Slope" of the trend line for Long Average Home Prices (chart below) had become much more "horizontal" or flatter; yet at this generally slower time of the year the price indicators are moving upward.  We see this as another confirmation that Battle Ground's popularity is as strong, if not stronger than ever.. 

Battle Ground Resale Home Sales 2014 - Average Sales Price Trends Battle Ground Resale Home Sales - Avg Sales Price Trend October 2015

The additional charts provided below are from RMLS for Battle Ground WA:


Charts of Battle Ground WA Resale Home Sales Trends in October 2015 Battle Ground Resale Home Sales Inventory & Days on Market Oct. 2015
With October's mini-surge in home sales, some interesting items to point out appear in the above graphs.  Thu unit-sales chart shows that the month of October closed more transactions than July or May!

The second chart shows that the Average transaction price exceeded the average price for new listings coming onto the market.  However, for this item the closed sales are still less than the prior month's average listing price.

Finally, the apparently dramatic increase in the Average Days on Market, and the Median Days on Market likely indicate that with such a shortage of inventory, even the "over-priced" listings are seeing action!

Thank you for reviewing this Battle Ground market report, and please send us any questions you may have!

PS - You are invited to visit the homes in Battle Ground WA page, where we have property listings from the entire RMLS.  Battle Ground WA homes are very popular in 2015.  Don't delay with your Home Selling or Buying Plans - Call Us Today!

A few of the popular Battle Ground WA Home Search Pages on our site include: Battle Ground WA Lots and Land for sale Homes on Acreage in Battle Ground WA; Luxury Homes in Battle Ground WA; One Level Ranch Homes in Battle Ground WA ; Condos for sale in Battle Ground WA

PPS - You may also want to check out additional great nearby communities such as: homes for sale in Hockinson WA; homes for sale in Ridgefield WA; homes for sale in La Center WA homes for sale in Vancouver WA.

The Battle Ground Washington Real Estate charts in this report (prepared by Realtor® John Slocum, our resident statistician) are based on home sales recorded in the Battle Ground  MLS system (RMLS), excluding sales of mobile home; and shows the purchase activity since 2009; charting the 3 month Moving average number of sales, and the 12 month Moving average.  This "smoothing" of the trend-data helps illustrate the short-term and longer term trends in the Battle Ground WA real estate market.

Disclaimer: as with any real estate statistics, we do our best to provide the best representation at the time the data was acquired.  We deem the data and reports reliable but not guaranteed.

Tuesday, December 1, 2015

Vancouver WA Condo Market Report October 2015

Vancouver WA Condo Market with Brisk Sales in October 2015!


 Condos and Townhomes for sale in Vancouver WA (aka Apartments-to-Own) are now facing an extreme shortage of available units to view!  Here are the highlights for October 2015:
  • Condo Average Sales Prices are moving in a seasonal downward direction, with the 3-Month Moving Average now at $192,696 closing down 4.35% over the prior October; and the 12-Month Moving Average closed up 5.72% from the prior year;
       
  • 51 Resale Condos were sold in October, which is about 7 (-12.1%) Fewer condos than in October 2014;
     
  • REO/Bank Owned Condo sales were 1 units (2.0% of total); down from 2 (3.4% of total) in October 2014.
     
  • Short Sale /Pre-Foreclosure property sales were 0 unit (0.0% of total); compared to 3 (5.2% of total) in October 2014.
Attached-Homes + Condos have performed a bit more strongly than Vancouver WA (SFR Homes so far in 2015.  In fact, the available supply of Condos readily available to sell has slipped again to 1.4 months; and for October the Average Days on Market was less than 20; with the Median Days at about 10!

Please continue with the Custom Condo Charts shown below for more of the story! 
Vancouver Washington Condo Sales September 2015 - Units Sold Vancouver WA Resale Condo Sales - Units Sold Trend September 2015
We continue to see the relatively steep decline in the short term trend-line for units-sold, while the long term trend-line's slope is now only a moderate rise - especially when compared to the steeper rise during 2014.  We believe one plausible explanation for the moderating increase in unit-sales is this segment of the Vancouver real estate market has fully recovered; and there are now only so many pre-owned condos that are going to be available for sale.

Average Condo Sales-Prices for this month are trending downwards, which may in large part be due to fewer of the Luxury Condos selling this year when compared to last year.  Again, the Vancouver market for this type of home is relatively small such that greater variability should be expected in the results for this segment.  Thus, the reality for most price-segments is that prices are still firm to increasing.
Vancouver WA Condo Sales September 2015 - Average Sales Price Trends Vancouver WA Resale Condo Sales - Average Sales Price Trend

The RMLS chats below show the most recent twelve (12) months of condo market action - through October 2015, for Unit Sales, Average & Median Prices; and Days on Market:
Charts of Vancouver WA Condo Sales Trends in September 2015 Vancouver Condo Sales Inventory & Days on Market Trends

October's results are shown in different elements with these final three charts. We have now had six (6) months with the Median Days on Market at the sub-20 mark. This month's results are astonishing however, with the Average Days on the Market hitting 20!

We hope you found this report on the Vancouver WA Condo Market to be helpful in your process to sell or buy in this market time.  Please contact us with any questions or comments; and to let us know how we can be of assistance!

PS - Please visit the Condominiums For Sale in Vancouver WA page at our website, where we have made it Easy to search by Neighborhood for Condos, with listings for condos from the entire RMLS.  You do not have to Sign-up to view Condominiums and Townhomes!

PPS - Don't wait any longer with your Condo Selling or Buying Plans - Call Us Soon!


The statistical charts for Vancouver WA Condos in this report (prepared by Vancouver WA Condo Realtor® John Slocum, our resident statistician) are based on condo sales recorded in the Vancouver MLS system (RMLS), excluding sales of newly constructed condos; and shows the purchase activity since 2009; charting the 3 month Moving average number of sales, and the 12 month Moving average.  The "smoothing" of the relatively sparse-data helps to better illustrate the short-term and longer term trends in Vancouver's Condominium market.

Disclaimer: as with all real estate statistics, we do our best to provide the best representation at the time the data was acquired.  We deem the data and reports reliable but not guaranteed.

Wednesday, November 18, 2015

Real Estate Market Report for Vancouver WA October 2015

Home Sales Still Relatively Strong in October 2015 for Vancouver WA !

We are still in a relatively Hot Real Estate Market despite the expected seasonal slowing for Vancouver Home Sales in October 2015.  Key elements for this past month:
  • 464 Resale Homes were sold in October 2015, which is 76 (19.6%) more homes than had sold in October 2014.
     
  • The Price Trend Lines show the 3-Month Moving Average trending downward, although up 6.52% over the prior year at $269,759; and the 12-Month Moving Average up 9.12%, and now at $261,651.
      
  • Short Sale /Pre-Foreclosure property sales were 6 units (1.3% of total); down greatly from last month; and a significant positive change compared to 12 (3.1% of total) in October of 2014.
  • REO/Bank Owned home sales were 19 units (4.1% of total); slowing the downward trend compared to 21 (5.4% of total) in October of 2014.
     
  • Inventory for Resale Homes at the end of October has slipped again and is now at 1.5 Months! - a Severe Seller's Market!
The Portland/Vancouver metro market area is still bucking the national trend for real estate in other parts of the country; as the retirement opportunity is huge in this area.  The charts below show how strong the current month has been especially when compared to the past two years.  
Vancouver Washington Resale Home Sales October 2015 - Units Sold Vancouver WA Resale Home Sales - Units Sold Trend October 2015

Looking specifically at the One-Year (12-Month rolling average) trend line (in-blue) two years ago the yearly average was 317 unit-sales per month; then 331 per month in 2014; and now 395 per month!  This is a whopping 19.3% increase in average monthly sales!    

The chart below is showing Vancouver's Resale Average Home Sales-Prices, and how the retreat below the flat-top has been minimal.  With the inventory level even less that previous months, we may see a smaller seasonal decrease in the average sales price this Fall and Winter.
Vancouver WA Resale Home Sales October 2015 - Average Sales Price Trends Vancouver WA Resale Home Sales - Average Sales Price Trend

79 properties (17.0%) closed at $200,000 or less when sold; with 166 (35.8%) sold that were priced $200,000 to $250,000. In comparison, in 2014 there 57.5% of the October sales were at $250k or below; while this October that is now at 52.8%.

From the Regional Multiple Listing Service the charts below show the past twelve-month's of action for Unit Sales, Average & Median Prices; and Days on Market:
RMLS Charts of Vancouver WA Resale Home Sales Trends in October 2015 Vancouver Resale Home Sales Inventory & Days on Market Trends

I know we are sounding like a broken-record here but this is phenomenal - we have now had seven (7) straight months where the Median Days on Market are less than 20 days; with the Average Days on Market for the past five (5) months very near 40 days!  Truly, we are still seeing a brisk sales environment.


PS - Please visit our Homes  Listed For Sale in Vancouver WA page.  We've made it Easy to search by Neighborhood or by Category, with Homes  and real estate listings from the entire RMLS.  Sign-up Not Required!

Some of the Popular Searches include: Cascade Park Homes; The Heights Homes; Hazel Dell / Lakeshore Homes; Felida Homes; Fishers Landing Homes; Minnehaha / Walnut Grove Homes; And Salmon Creek Homes.

A few new neighborhoods we've recently added include: The Firs at Towncenter; Buckman Garden Tracts; The Reserve at Ashley Ridge, Hearthwood; Countryside Woods; Fircrest

PPS -2015 is breaking records for the Vancouver Washington real estate market.  Do You Have Home Selling or Buying Plans this Autumn/Winter Season? - Call Us Right Away!


This report and custom charts (prepared by John Slocum Realtor®, our resident statistician) are based on home sales posted in the Vancouver MLS system (RMLS), excluding sales of mobile home; and shows the purchase activity since 2009; charting the 3 month Moving average number of sales, and the 12 month Moving average.  This "smoothing" of the trend-data helps illustrate the short-term and longer term trends in Vancouver WA's real estate market.

Disclaimer: as with any real estate statistics, we do our best to provide the best representation at the time the data was acquired.  We deem the data and reports reliable but not guaranteed.

Thursday, October 29, 2015

Condo Market Report for Vancouver WA September 2015

Condo Market Running out of Supply in Vancouver for September 2015!

Tidewater Cove Luxury Waterfront Condos in Vancouver WA

 Condos for sale in Vancouver WA (aka Apartments-to-Own) have done so well, especially in terms of Unit-Sales-Volume, we have entered an extreme scarcity of condos available for sale!  Here are the highlights for September2015:

  • Condo Average Sales Prices have actually moved more of a sideways direction, with the 3-Month Moving Average now at $198,428 closing down 0.44% over the prior September; and the 12-Month Moving Average closed up 9.0%
       
  • 50 Resale Condos were sold in September, which is about 17 (-28.3%) Fewer condos than in September 2014;
     
  • REO/Bank Owned Condo sales were 0 units (0.0% of total); down from 11 (16.4% of total) in September 2014.
     
  • Short Sale /Pre-Foreclosure property sales were 1 unit (2.0% of total); compared to 2 (3.0% of total) in September 2014.

Like we have seen for Single-Family Residential (SFR) Homes for sale in Vancouver WA, Condominiums and Attached-Homes have perform very well so far in 2015.  However, the demand has been so great that the available inventory is in extremely short supply currently - at 1.5 months of available inventory!

Our Custom Condo Charts for Vancouver will help tell the story! 

Vancouver Washington Condo Sales September 2015 - Units Sold Vancouver WA Resale Condo Sales - Units Sold Trend September 2015

The units-sold chart (above) is showing the typical seasonal retreat however, since the inventory level is so very low, we suspect there would be much less indicated slowing if there were more condos available for sale!  Is this a trend that suggest more Condo projects need to be built in Vancouver?!   In fact we are seeing new condo or attached homes going in at places like The Lakes Condos; Renaissance at Hiddenbrook Townhomes; Stoneleaf Townhomes; and Erickson Farms.

This month's Average Condo Sales-Prices are slightly contradictory showing an inability for the short-term trend line to surpass the level achieved in 2014.  However, we must remember this is a relatively small market where a sale or two at the luxury end of the market can cause the price-averages to move quite a bit for any particular month/quarter.  It is worth noting that the Long Term trend-line is clearly showing a "Top Formation" with the direction being in a side-ways to slightly downward direction at this time.

Vancouver WA Condo Sales September 2015 - Average Sales Price Trends Vancouver WA Resale Condo Sales - Average Sales Price Trend


The set of RMLS chats below show the most recent twelve (12) months of action - through September 2015, for Unit Sales, Average & Median Prices; and Days on Market:

Charts of Vancouver WA Condo Sales Trends in September 2015 Vancouver Condo Sales Inventory & Days on Market Trends


September's very strong performance is shown in this last trio of charts. With now 5 Months for the Median Days on Market at the sub-20 market.  This is clearly a good time for a Condo Seller to put their home on the market, and a Condo buyer to be one-hundred (100%) percent prepared to make their purchase when that right condo becomes available! 

We hope you found this Vancouver WA Condo Market to be informative.  Please contact us with any questions or comments; and to let us know your selling or buying plans!


PS - Please visit the Condos For Sale in Vancouver WA page at our website, where we have made it Easy to search by Neighborhood for Condos, with listings for condos from the entire RMLS.  You do not have to Sign-up to view Condos!

PPS - Don't wait any longer with your Condo Selling or Buying Plans - Call Us Soon!


The statistical charts for Vancouver WA Condos in this report (prepared by Vancouver WA Realtor® John Slocum, our resident statistician) are based on condo sales recorded in the Vancouver MLS system (RMLS), excluding sales of newly constructed condos; and shows the purchase activity since 2009; charting the 3 month Moving average number of sales, and the 12 month Moving average.  The "smoothing" of the relatively sparse-data helps to better illustrate the short-term and longer term trends in Vancouver's Condo market.

Disclaimer: as with all real estate statistics, we do our best to provide the best representation at the time the data was acquired.  We deem the data and reports reliable but not guaranteed.

Monday, October 26, 2015

Real Estate Market Report for Vancouver WA September 2015

Home Sales Show Seasonal Slowing for September 2015 in Vancouver WA !

The expected evidence of the seasonal peak has made itself clear for the sales data for Vancouver Home Sales for September 2015.  Key stats for this past month:
  • 420 Resale Homes were sold in September 2015, which is 3 (<1%) more homes than had sold in September 2014.
     
  • The Price Trend Lines show the 3-Month Moving Average trending downward, although up 6.34% over the prior year at $271,847; and the 12-Month Moving Average up 9.40%, and now at $259,441.
      
  • Short Sale /Pre-Foreclosure property sales were 13 units (3.1% of total); up slightly from last month; and a substantial positive change compared to 21 (5.04% of total) in September of 2014.
  • REO/Bank Owned home sales were 14 units (3.3% of total); slowing their downward trend compared to 36 (8.6% of total) in September of 2014.
     
  • Inventory for Resale Homes at the end of September has slipped to 1.8 Months! - a Seller's Market that has become more extreme!
The graphical part of our presentation comes with real estate market charts to we have prepared that allow the monthly-reported data to be smoothed into 3-month and 12-month rolling averages.

The Portland/Vancouver metro market area has made national news as being one of the stronger real estate markets in the country; owing to a relatively large in-migration to this area.  This growth appears to reflect itself at this time of the year with the average sales showing more of a "pause" rather than a "retreat."  
Vancouver Washington Resale Home Sales September 2015 - Units Sold Vancouver WA Resale Home Sales - Units Sold Trend September 2015

Although the Unit Sales trend is showing the seasonal slowing, of note this year is the much higher level it has achieved for early Fall - about 10% higher than in the previous two years at this time.    

The chart below is showing Vancouver's Resale Average Home Sales-Prices, and how the flat-top has continued from last month!  When we recall from above that the Inventory level has been reduced from 2+ to 1.8 months, it makes sense there is downward resistance in this price-trend line.
Vancouver WA Resale Home Sales September 2015 - Average Sales Price Trends Vancouver WA Resale Home Sales - Average Sales Price Trend

77 properties (18.3%) were priced $200,000 or less when sold; with 151 (36.0%) sold that were priced $200,000 to $250,000. In comparison, in 2014 there 62.35% of the September sales were at $250k or below; while this September that is now at 54.3%.

From the Regional Multiple Listing Service the charts below show the past twelve-month's of action for Unit Sales, Average & Median Prices; and Days on Market:
RMLS Charts of Vancouver WA Resale Home Sales Trends in September 2015 Vancouver Resale Home Sales Inventory & Days on Market Trends

WOW! - we have now had six straight (6) months where the Median Days on Market are less than 20 days!  The overall Average Days on Market is also at the lowest point for the entire year!


PS - Please visit our Homes  Currently Listed For Sale in Vancouver WA page.  We've made it Easy to search by Neighborhood or by Category, with Homes  and real estate listings from the entire RMLS.  Sign-up Not Required!

Some of the Popular Searches include: Cascade Park Homes; The Heights Homes; Hazel Dell / Lakeshore Homes; Felida Homes; Fishers Landing Homes; Minnehaha / Walnut Grove Homes; And Salmon Creek Homes.


PPS -2015 is breaking records for the Vancouver Washington real estate market.  Do You Have Home Selling or Buying Plans this Autumn Season? - Call Us Right Away!


This report and custom charts (prepared by John Slocum Realtor®, our resident statistician) are based on home sales posted in the Vancouver MLS system (RMLS), excluding sales of mobile home; and shows the purchase activity since 2009; charting the 3 month Moving average number of sales, and the 12 month Moving average.  This "smoothing" of the trend-data helps illustrate the short-term and longer term trends in Vancouver WA's real estate market.

Disclaimer: as with any real estate statistics, we do our best to provide the best representation at the time the data was acquired.  We deem the data and reports reliable but not guaranteed.

Thursday, September 17, 2015

Vancouver WA Real Estate Market Report for August 2015

Home Sales Peaking for August 2015 in Vancouver WA !

As we made our way through the last full month of Summer 2015, it was becoming clear that the typical seasonal slowing would be taking place, and the final tally for August bears that out. Here are the key points for this past month:
  • 421 Resale Homes were sold in August 2015, which is 4 (1%) more homes than had sold in August 2014.
     
  • The Price Trend Lines are both going horizontal, with the 3-Month Moving Average up 6.18% over the prior year at $272,112; and the 12-Month Moving Average up 9.22%, and now at $257,076.
      
  • Short Sale /Pre-Foreclosure property sales were 11 units (2.6% of total); down from last month; and a substantial positive change compared to 24 (5.8% of total) in August of 2014.
  • REO/Bank Owned home sales were 17 units (4.0% of total); resuming their downward trend compared to 34 (8.2% of total) in August of 2014.
     
  • Inventory for Resale Homes at the end of August is still at 2.1 Months! - a Seller's Market but not getting more extreme!
We have prepared several real estate market charts to allow you to see the current condition(s), and the distance plus direction we've covered since the 2009 time-frame.  Nationwide the National Association of Realtors (NAR) is reporting that the median home sales price is now above the previous peak for that measure last seen in 2006 (see: NAR Home Prices Peak ).  In our market we likely saw the very highest average sales price in July, with that average starting to slip in August - resulting in a 3-month average statistic that looks "flat."  

We'll first start with Unit Sales (sheer number of homes & condos sold) for the Resale Category.  You'll see the 3-month Moving Average is in red; and the longer term trend line (12-months) Moving Average is in blue. 
Vancouver Washington Resale Home Sales August 2015 - Units Sold Vancouver WA Resale Home Sales - Units Sold Trend August 2015

Unlike previous years where the turning point appears as a sharp peak; in 2015 we have developed a "flatter looking top" for unit sales.  We also note that the absolute higher level of the peak when compared to previous years gives the reader a clear idea of how much more active the current market has been.  We agree with Dr. Yun at NAR that there has been pent-up demand both by first-time buyers; and returning home-buyers (previous foreclosures and short-sales) that have decided to break free of the rent-vs-own paradox.    

The next chart graphic below shows Vancouver's Resale Average Home Sales-Prices have also formed a flat-top!  What this suggests is that the expected "seasonal slowdown" may not be as slow as what we typically see from previous years results.
Vancouver WA Resale Home Sales August 2015 - Average Sales Price Trends Vancouver WA Resale Home Sales - Average Sales Price Trend

92 properties (21.9%) were priced $200,000 or less when sold; with 147 (34.9%) sold that were priced $200,000 to $250,000. In comparison, in 2014 there 62.4% of the August sales were at $250k or below; while this August that is now at 57%.

From RMLS the charts below show the recent twelve-month's of action for Unit Sales, Average & Median Prices; and Days on Market:
RMLS Charts of Vancouver WA Resale Home Sales Trends in August 2015 Vancouver Resale Home Sales Inventory & Days on Market Trends

We have now had five (5) months where the Median Days on Market are less than 20 days!  Home-buyers take note - you still must be prepared to act, and not think overnight for many of these properties!


PS - Please visit our Homes For Sale in Vancouver WA page.  We've made it Easy to search by Neighborhood or by Category, with Homes  and real estate listings from the entire RMLS.  Sign-up Not Required!

PPS -2015 is breaking records for the Vancouver Washington real estate market.  Do You Have Home Selling or Buying Plans this year? - Call Us Right Away!


This report and custom charts (prepared by John Slocum Realtor®, our resident statistician) are based on home sales posted in the Vancouver MLS system (RMLS), excluding sales of mobile home; and shows the purchase activity since 2009; charting the 3 month Moving average number of sales, and the 12 month Moving average.  This "smoothing" of the trend-data helps illustrate the short-term and longer term trends in Vancouver WA's real estate market.

Disclaimer: as with any real estate statistics, we do our best to provide the best representation at the time the data was acquired.  We deem the data and reports reliable but not guaranteed.

Thursday, August 27, 2015

Condo Market Report for Vancouver WA - July 2015

Vancouver's Condo Market Going Strong in July 2015!

Shorewood West Condos in Vancouver WA

 Condos for sale in Vancouver WA (aka Apartments-to-Own) are doing extremely well for improvement in both Unit-Sales-Volume, and Average Sales Price.  Here are the highlights for July 2015:

  • Condo Average Sales Prices have moved up strongly, with the 3-Month Moving Average now at $201,790 closing up 14.9% over the prior July; and the 12-Month Moving Average closed up 18.5%
       
  • 75 Resale Condos were sold in July, which is about 23 (44.2%) more condos than in July 2014;
     
  • REO/Bank Owned Condo sales were 5 units (6.7% of total); up from 3 (5.8% of total) in July 2014.
     
  • Short Sale /Pre-Foreclosure property sales were 2 units (1.7% of total); compared to 4 (7.7% of total) in July 2014.

Similar to SFR Homes for sale in Vancouver WA, Condos and Attached-Homes have seen a very strong increase in unit-volume however, this group's average price increase is at almost twice the rate!  We continue to see the Distressed-property segment for Condos shrinking, getting closer to more traditional low-levels.

Next we'd like to share our Custom Charts for Vancouver Condos! 

Vancouver Washington Condo Sales July 2015 - Units Sold Vancouver WA Resale Condo Sales - Units Sold Trend July 2015


The chart above for condo units-sold shows we are clearly in record territory, with the monthly average above 50 units (long-term) and close to 70 for the summer season!  If this year's pattern follows that of last year, we may be near the peak for the year in terms of number of condos sold.

July's results for Average Condo Sales-Prices also show we are in record-setting territory, with the 3-month moving average line (in red) still strongly upward.  Again, as we are near the end of the summer, we may see average sales prices start to moderate somewhat.

Vancouver WA Condo Sales July 2015 - Average Sales Price Trends Vancouver WA Resale Condo Sales - Average Sales Price Trend


The set of RMLS chats below show the month-by-month action - through July 2015, for Unit Sales, Average & Median Prices; and Days on Market:

Charts of Vancouver WA Condo Sales Trends in July 2015 Vancouver Condo Sales Inventory & Days on Market Trends


July's very strong performance is shown in this last trio of charts. With 3 Months for the Median Days on Market below 20 - condo buyers must be ready to act quickly when a new listing comes out!  RMLS is showing the Inventory level for Vancouver Condos at 1.7 months - which is still an extreme Seller's Market level. 

Thank you for taking the time to learn more about the Condo Market in Vancouver Washington.  You are invited to contact us with any questions or comments; and to let us know your selling or buying plans!


PS - Please visit the Condos For Sale in Vancouver WA page at our website, where we have made it Easy to search by Neighborhood for Condos, with listings for condos from the entire RMLS.  You do not have to Sign-up to view Condos!

PPS - Don't wait any longer with your Condo Selling or Buying Plans - Call Us Soon!


The statistical charts for Vancouver WA Condos in this report (prepared by Vancouver WA Realtor® John Slocum, our resident statistician) are based on condo sales recorded in the Vancouver MLS system (RMLS), excluding sales of newly constructed condos; and shows the purchase activity since 2009; charting the 3 month Moving average number of sales, and the 12 month Moving average.  The "smoothing" of the relatively sparse-data helps to better illustrate the short-term and longer term trends in Vancouver's Condo market.

Disclaimer: as with all real estate statistics, we do our best to provide the best representation at the time the data was acquired.  We deem the data and reports reliable but not guaranteed.

Monday, August 10, 2015

Real Estate Market Results for Vancouver WA in July 2015

Home Sales Going Strong for July 2015 in Vancouver WA !

Despite some news reports that suggest a slowing in the local real estate scene, Vancouver Washington's July 2015 tally shows continued strong momentum, combined with the Median Days On Market for the 4th  month at less than 20 days!  Here are the highlight for July:
  • 467 Resale Homes were sold in July 2015, which is 45 (10.7%) more homes than had sold in July 2014, although 44 fewer homes sold than June 2015 (June '15 was truly a record breaking month!).
     
  • The Price Trend Lines are quite strong, with the 3-Month Moving Average up 10.65% at $272,476; and the 12-Month Moving Average up 10.83%, and now at $257,124.
      
  • Short Sale /Pre-Foreclosure property sales were 17 units (3.6% of total); up slightly from last month; and a definite improvement compared to 26 (6.2% of total) in July of 2014.
  • REO/Bank Owned home sales were 31 units (6.6% of total); and in a somewhat "side-ways" trend compared to 28 (6.6% of total) in July of 2014.
     
  • Inventory for Resale Homes at the end of July was again at 2.1 Months! - to be sure a Seller's Market!
Market Charts for the Vancouver WA Real Estate are a great way to show just how strong the current rally is. We've taken the time to develop these ourselves to allow a better depiction of the short-term and longer-term trends.  

The Quantity (Unit-Sales) of Resale Homes sold (Excludes New Construction) is up first. The simple method of statistical smoothing to show the short term trend line -- the 3-month Moving Average is in red; and the longer term trend line -- the 12-month Moving Average is in blue. 
Vancouver Washington Resale Home Sales July 2015 - Units Sold Vancouver WA Resale Home Sales - Units Sold Trend July 2015

What is clear with the above chart is the short-term trend made its seasonal turn upward at a much higher lavel than in previous years; and now in mid-summer as it nears another turning point, it is already substantially higher than in the previous two years!  

The chart graphic below shows Vancouver's Resale Average Home Sales-Prices for July 2015 are now attempting to break a new record!
Vancouver WA Resale Home Sales July 2015 - Average Sales Price Trends Vancouver WA Resale Home Sales - Average Sales Price Trend

103 properties (22%) were priced $200,000 or less when sold; with 162 (35%) sold that were priced $200,000 to $250,000. In comparison, in 2014 there 62% of the July sales were at $250k or below; while this July that is now at 55%.

From RMLS the charts below show the recent twelve-month's of action for Unit Sales, Average & Median Prices; and Days on Market:
RMLS Charts of Vancouver WA Resale Home Sales Trends in July 2015 Vancouver Resale Home Sales Inventory & Days on Market Trends

With the 4th month and the Median Days on Market are less than 20 days, this has truly been a hot season!


PS - You are invited to visit our Homes For Sale in Vancouver WA page.  Where it is Easy to search by Neighborhood or by Category, with Homes  and real estate listings from the entire RMLS.  Sign-up Not Required!

PPS -2015 is breaking records for the Vancouver Washington real estate market.  Do You Have Home Selling or Buying Plans this year? - Call Us Right Away!


This report and custom charts (prepared by John Slocum Realtor®, our resident statistician) are based on home sales posted in the Vancouver MLS system (RMLS), excluding sales of mobile home; and shows the purchase activity since 2009; charting the 3 month Moving average number of sales, and the 12 month Moving average.  This "smoothing" of the trend-data helps illustrate the short-term and longer term trends in Vancouver WA's real estate market.

Disclaimer: as with any real estate statistics, we do our best to provide the best representation at the time the data was acquired.  We deem the data and reports reliable but not guaranteed.

Friday, July 31, 2015

Real Estate Results for Vancouver WA June 2015

Real Estate Topping the Charts for June 2015 for Vancouver WA !

The Vancouver Washington 2015 Real Estate Market Rally turned phenomenal results for June; combined with the Median Days On Market still less than 20 days!  Here are the highlight for June:
  • 509 Resale Homes were sold in June 2015, which is 79 (18.4%) more homes than had sold in June 2014.
     
  • The Price Trend Lines are still very strong, with the 3-Month Moving Average up 10.44% at $265,053; and the 12-Month Moving Average up 10.93%, and now at $254,656.
      
  • Short Sale /Pre-Foreclosure property sales were 16 units (3.1% of total); down from last month; and a nice improvement when compared to 24 (5.6% of total) in June of 2014.
  • REO/Bank Owned home sales were 28 units (5.5% of total); and in a downward trend compared to 42 (9.8% of total) in June of 2014.
     
  • Inventory for Resale Homes at the end of June was at 2.1 Months! - a slight change in the Buyer's favor but, still very much a Seller's Market!
Up next are the important Vancouver WA Real Estate Market Charts we'd like to share! 

The Quantity (Unit-Sales) of Resale Homes sold (Excludes New Construction) are the first to be shown.  We use the simple method of statistical smoothing to show the short term trend line -- the 3-month Moving Average; and the longer term trend line -- the 12-month Moving Average. 
Vancouver Washington Resale Home Sales June 2015 - Units Sold Vancouver WA Resale Home Sales - Units Sold Trend June 2015

Recent National news has talked about the Real Estate Market Pending Sales cooling in June. What that headline fails to capture for Vancouver WA, is the early increased purchase/sale activity locally that has taken place so far in 2015.  

Vancouver's Resale Average Home Sales-Prices for June 2015 are still in a strong upward move, as the chart below shows.
Vancouver WA Resale Home Sales June 2015 - Average Sales Price Trends Vancouver WA Resale Home Sales - Average Sales Price Trend

111 properties (22%) were priced $200,000 or less when sold; with 147 (29%) sold that were priced $200,000 to $250,000. This rapid rise in home sales-prices has been making it more difficult for entry-level or, first-time home-buyers to make their purchase..   

These chats below are from RMLS showing the most recent twelve-month's of action for Unit Sales, Average & Median Prices; and Days on Market:
RMLS Charts of Vancouver WA Resale Home Sales Trends in June 2015 Vancouver Resale Home Sales Inventory & Days on Market Trends

With another month at less than 20 Median Days on Market, we are clearly in a very hot real estate market!


PS - Please visit our Vancouver WA Homes For Sale page.  We've made it is Easy to search by Neighborhood or by Category, with Homes  and real estate listings from the entire RMLS.  Sign-up Not Required!

PPS -2015 is on a record-breaking pace for the Vancouver Washington real estate market.  Do You Have Home Selling or Buying Plans this year? - Call Us Right Away!


The custom charts in this report (prepared by John Slocum Realtor®, our resident statistician) are based on home sales posted in the Vancouver MLS system (RMLS), excluding sales of mobile home; and shows the purchase activity since 2009; charting the 3 month Moving average number of sales, and the 12 month Moving average.  This "smoothing" of the trend-data helps illustrate the short-term and longer term trends in Vancouver WA's real estate market.

Disclaimer: as with any real estate statistics, we do our best to provide the best representation at the time the data was acquired.  We deem the data and reports reliable but not guaranteed.

Saturday, June 27, 2015

Visiting the Recycled Arts Festival in Vancouver WA 2015

Taking in the Recycled Arts Festival in Downtown Vancouver WA June 2015!

Today's weather (June 27, 2015) is expected to hit 97 degrees, which is a bit on the blistering hot side for us however, very high-level clouds in the morning kept the heat away long enough for us to visit the #RAFClarkWA - Recycled Arts Festival in Esther Short Park, in downtown Vancouver.

It is without question that much the "discarded" materials of our modern world or in some cases, from the recent past, can be turned into art or usable items.  The #RAFClarkWA participants used a broad spectrum of recycled elements, from Metal, Glass, and Wood to Fabrics and Plastic.

Here are just a small sampling of what you see if you visit yourself:
Clever and Imaaginative Creature at the Recycled Arts Festival 2015 Imaginative Metal Creature - #RAFClarkWA - June 2015

This quirky metal fisherman is casting his line out, trying to snag a buyer to take them home!

Cycling Gears and Colorful Glass at the Recycled Arts Festival 2015 Colorful Glass and Cycling Gears - #RAFClarkWA - June 2015

This is quite the combination of Bicycle parts - mostly gears, and colorful glass!

Impressive Driftwood Man at the Recycled Arts Festival 2015 Tall and Impressive Driftwood Man - #RAFClarkWA - June 2015

I always love going to the beach and seeing the driftwood, and sometimes taking home unique pieces.  This person has carried that interest into their art with some amazing results, such as this tall Driftwood Man, and the Heart next to it!

Vendors next to Heritage Place Condos at the Recycled Arts Festival 2015 Vendors next to Heritage Place Condos - #RAFClarkWA - June 2015

This year they had so many vendors (about 115 we were told) that 8th St was blocked between Columbia and Esther, next to the Heritage Place Condos.

Bandstand with Live Music at the Recycled Arts Festival 2015 Bandstand with Live Music - #RAFClarkWA - June 2015

Of course with a permanent Bandstand at the park, the appropriate filler is a real band with Live Music!

The Festival continues through to 6:00 pm on the 27th, and !0;00 to 4:00 pm on June 28th, 2015.  They have several misting stations and fans but, you'll still want to bring lots of fresh water as the temperature may hit or exceed 100 degrees! (Revision 6/28 am - the weatherman is now predicting a high of 88 degrees with a chance of thunderstorms!)

PS - The Downtown Vancouver WA area is a favorite of ours for serving our real estate customers whether you want Condos in Downtown Vancouver WA; Homes in Downtown Vancouver WA or, Commercial Property in Vancouver WA - we've got you covered!


The photos and narrative were prepared by Vancouver WA Real Estate Broker John Slocum, on June 27, 2015, all rights reserved.

Friday, June 19, 2015

Luxury Home Market Report For Vancouver WA May 2015

Surging Sales Results for Vancouver's Luxury Home Market in 2015!

Luxury Homes in Vancouver WA

 Vancouver Washington Luxury Homes had taken a substantial hit during the market crash but have been making a nice comeback the past couple of years. So far in 2015 the unit-volume has been substantially better than in prior periods.  Here's the current view:

  • Average Sales Prices are lingering in the area just under $1,000,000.showing the logical greater activity in the $700,000 and slightly above price area.
       
  • 17 Vancouver Luxury Homes were sold through May 2015; compared to 11 in the same period in 2014;
     
  • REO/Bank Owned Luxury Home sales were 0 units; down from 1 in 2014.
     
  • Short Sale /Pre-Foreclosure property sales were 0 - no change from last year.

With the incredible surge in sales of homes in Vancouver WA, especially in the lower price-tiers; there has most certainly been benefit to the Luxury Home tier with "Move Up" buyers now able to actually make such a purchase.  We are also seeing renewed interest form Oregon and California buyers that also want the benefit of No Personal Income Tax here in Washington - combined with the relatively lower cost of a true luxury home!.

Next in line will be our custom charts for Vancouver Luxury Homes: 

Vancouver Washington Luxury Home Sales May 2015 - Units Sold Vancouver WA Luxury Home Sales - Units Sold Trend


The Vancouver WA Luxury Home market is a sub-element of the overall real estate market  thus, the trend line will look unique owing to the relatively smaller statistical-population of units sold each month.  This market segment has lagged the general market by about a year; with a clear upward move starting in early 2013 with the 12 month trend-line (in blue) going from an average of one (1) sale per month to four (4) per month!

Continuing on (below),  the results for Average Luxury Home Sales-Prices are more difficult to illustrate, since the data is not starting at a true zero; and more luxury homes are "graduating up" from the sub-$700,000 cut-off for this report as the market prices rise.

Vancouver WA Luxury Homes and Real Estate Sales May 2015 - Average Sales Price Trends Vancouver WA Luxury Home Sales - Average Sales Price Trend


The set of RMLS chats below show the month-by-month action January 2010 - through May 2015, for Listings & Unit Sales, Average & Median Prices; and Days on Market:

Charts of Vancouver WA Luxury Real Estate and Home Sales Trends in May 2015 Vancouver Luxury Home Sales Inventory & Days on Market Trends


The Inventory by Month graphic helps illustrate how sparse the sales were for the first half of this 5+ year period in this price-tier; with the more recent years seeing much greater activity. 

The Days on Market chart is another way to show the improved health of this price tier.  The first half of the time period had some very "long in the tooth" listings finally sell; while the more recent years the Average time on the market is more reasonable.

List of Vancouver WA Luxury Real Estate and Home Sold 2015 YTD Vancouver Luxury Homes Sold Year-to-Date


When working on this report it became clear that providing some of the basic information on each of the properties sold so far this year may be of benefit to our readers.  As you can see (you can view the larger image on a separate tab/window) there is a great variety of homes sold in neighborhoods ranging from the Columbia River Waterfront / Rivershore Drive area, to the luxury homes in the Felida & Lake Shore area to the Northwest part of Vancouver. 


Note - The RE/MAX Collection qualifications for the Vancouver area has until recently been about $500,000 and above.  With the great rise in average market prices we've chosen a cut-off of $700,000 for this report to ensure we are showing you Luxury Properties.
 
PS
- You are invited to visit our Real Estate in Vancouver WA website, where we have made it Easy to search by Neighborhood for luxury homes and property from the entire RMLS.  You do not have to Sign-up to view luxury homes!

PPS - Don't wait any longer with your Home Selling or Buying Plans - Call Us Soon!


The statistical charts for Vancouver WA Luxury Homes in this report (prepared by Vancouver WA Realtor® John Slocum, our statistician & Econ/Math major) are based on luxury real estate sales recorded in the Vancouver MLS system (RMLS), charting the 3 month Moving average number of sales, and the 12 month Moving average.  The "smoothing" of the relatively sparse-data helps to better illustrate the short-term and longer term trends in Vancouver's Luxury Property market.

Disclaimer: as with all real estate and property statistics, we do our very best to provide the most informative representation at the time the data was acquired.  We deem the data and reports reliable but not guaranteed.