Saturday, February 25, 2017

98665 Homes For Sale - January 2017 Report

Very Low Inventory  for Vancouver WA Home Sales in 98665 for January 2017!


Despite Winter weather dumping a bunch of snow on our area, this part of Vancouver WA has ended up with less than 1 month's supply of Active Homes For Sale Inventory!  Both Buyers and Sellers in the 98665 Zip Code must take notice.  Here are this month's key points from RMLS:

  • 19 Units Closed, with 23 Units going Pending;
       
  • The Average Sales Price was $292,557; with the Average New Listing's price at $405,841.
     
  • Cumulative Days On Market (CDOM) Averaged 49 Days - very brisk sales for a mid-Winter Month.
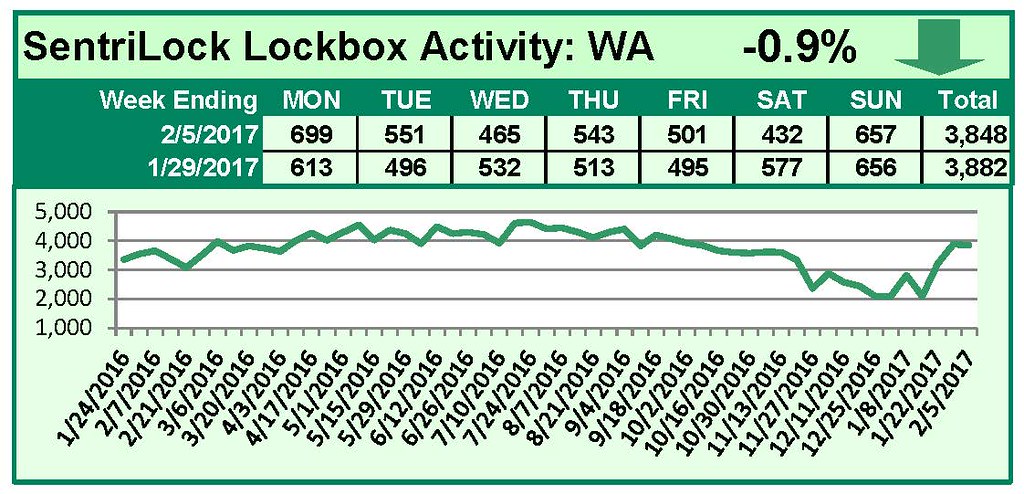
  • The Level of Inventory is at 0.9 Months, which is a sliver better than Vancouver's 0.8 Months - indeed an Extreme Seller's Market!
Starting this year with such a low level of Active Listings, this part of Vancouver is sure to see brisk sales activity for at least the next 3 to 6 months time. Interest rates are still so very low, and this location is very convenient for most commuters, whether they work in Washington or Oregon.

We have prepared charts showing Unit Sales, Average & Median Prices; and Days on Market information are shown below (from RMLS chart-tools):

Charts of Vancouver WA Condo Sales Trends in January 2017 Vancouver 98665 Sales Inventory & Days on Market Trends

The Inventory-by-Month chart is showing the low level of activity we see in the Winter Season for Closed Sales , with New Listings making a stronger upward move than we've seen in some other areas.

The second graph shows that sellers are looking for higher list-prices, which are perhaps a logical outcome with so few homes available for sale.

Average Days on Market and Median Days on market measurements are both are less than 60 days which is a strong sign of a hot market!

Thank you for visiting and reading our report on the Vancouver WA 98665 Real Estate Market in January 2017.  Please contact us with any questions or comments; and to let us know how we can be of assistance!


PS
- Don't wait any longer with your Selling or Buying Plans in the 98665 Zip Code - Call Us Today!   We also offer a no-cost, no-obligation Vancouver WA 98665 Market Price Valuation, and invite you to try it out!

 PPS - You are invited to visit the 98665 Homes For Sale page at our website, where we have made Home Search  You do not have to Sign-up to view the Listed Properties!  You may also Search these Neighborhoods in 98665: Hazel Dell Homes For Sale; NE Hazel Dell & South Salmon Creek; and NW Hazel Dell & Lake ShoreHomes For Sale.


The 98665 market information statistical charts in this report (prepared by Vancouver WA 98665 Listing Realtor® John Slocum, our resident statistician) are based on sales recorded in the Vancouver MLS system (RMLS) for Zip Code 98665, excluding sales of newly constructed condos; and shows the purchase activity since 2009; charting the 3 month Moving average number of sales, and the 12 month Moving average.  The "smoothing" of the relatively sparse-data helps to better illustrate the short-term and longer term trends in Vancouver's Housing market.

Disclaimer: as with all real estate statistics, we do our best to provide the best representation at the time the data was acquired.  We deem the data and reports reliable but not guaranteed.

Friday, February 24, 2017

Real Estate Market Report for Vancouver WA - January 2017

Dearth of Inventory for Vancouver Washington in January 2017

As we enter the sixth year of rising home prices in Vancouver Washington, we are also entering the time when Availability and Affordability of Active Listings is declining. Key Stats in January 2017 include:
  • 276 Pre-owned Homes were sold
     
  • Inventory Level at 0.8 Months of Supply (6 months supply is a "normal" market)
      
  • 5 Short Sale and 12 Bank Owned / REO sales closed.
  • Approximately 279 pre-owned properties sold in the RMLS, at approximately $84,668,000 in value.  Average sales price = $303,471
     
  • Approximately 67 New properties sold in RMLS at approximately $24,826,000 in value. Average sales price = $370,536
Lack of sufficient Available Active Inventory is shaping up to be a key challenge for home buyers this year. We cannot stress enough the need to save up for the funds necessary to secure your home loan, and also get your Debt-to-Income ratio in a healthy position (39% or less may be best).

We have prepared three charts (from the Regional Multiple Listing Service) to illustrate the real estate market results for Unit Sales, Average & Median Prices; and Days on Market:

RMLS Charts of Vancouver WA Resale Home Sales Trends for January 2017 Vancouver Resale Home Sales Inventory & Days on Market Trends

The Inventory By Month graph tells us that the new listings are not yet at a high enough level to improve the inventory level significantly.  

The second graph is showing that new listings are expecting to be able to achieve a higher sales price compared to the recently sold properties.

Lastly, the Days on Market indicators confirm we are in a fast-paced, Seller's Market.

Thanks for visiting and reading our update on Home Sales and Real Estate News for Vancouver Washington. You are invited to call us with any questions, or requests for assistance.

PS - the 2017 home sales market for Vancouver WA is expected to remain a Seller's market in the near term.  If you ace planning on Selling and want to know what your home is worth -  we offer a no-cost, no-obligation Real Estate Home Value for your Vancouver WA Home.  We also have on-line form to request your Home Market Analysis,,  Either way we trust you won't delay!

PPS - Now is a great time to visit our Homes For Sale Vancouver WA page, or the separate page for Condos for sale in Vancouver WA.  We've put much custom work in to make it Easy for You to search by Neighborhood or by Category, with Homes  and real estate listings from the entire RMLS.  Sign-up Not Required!

Some of the Popular Searches include:  Cascade Park Homes; The Heights Homes; Felida Homes; Fishers Landing Homes; Hazel Dell / Lakeshore Homes; Minnehaha / Walnut Grove Homes; and Salmon Creek Homes.

We also have Category searches including: Acreage Homes Vancouver WA; Listing Real Estate Agent Vancouver WA; One-Level Ranch Homes for sale in Vancouver WA.

This report and custom charts (prepared by John Slocum Realtor®, our resident statistician) are based on home sales posted in the Vancouver MLS system (RMLS), excluding sales of mobile home; and shows the purchase activity since 2009; charting the 3 month Moving average number of sales, and the 12 month Moving average.  This "smoothing" of the trend-data helps illustrate the short-term and longer term trends in Vancouver WA's real estate market.

Disclaimer: with any real estate statistics, we've done our best to provide the best representation at the time the data was acquired.  We deem the data and reports reliable but not guaranteed.

Monday, February 20, 2017

98685 Homes For Sale - January 2017 Report

Vancouver WA Home Sales in 98685 Slow with the Wintry January 2017 Weather!


 2017's Winter Weather has delivered some Epic Snow and Rainstorms, and to be sure has had some effect on the activity of both Buyers and Sellers in the 98685 Zip Code.  Here are this month's highlights from RMLS:

  • 18 Units Closed, with 32 Units going Pending;
       
  • The Average Sales Price was $333,195; with the Average New Listing's price at $372,000.
     
  • Cumulative Days On Market (CDOM) Averaged 54 Days - relatively brisk sales for a Winter Month.
  • The Level of Inventory is at 1.4 Months, which is slightly better than Vancouver's 0.8 Months - very much a Severe Seller's Market!
Moving into the traditionally stronger months for real estate activity, we are expecting 2017 to start out as brisk of a pace as in 2016, with strong upward pressure on prices.  With the level of inventory so low, there are just too many buyers for the number of Active listings..

A chart of Unit Sales, Average & Median Prices; and Days on Market information are shown below (from RMLS chart-tools):

Charts of Vancouver WA 98685 Sales Trends in January 2017 Vancouver 98685 Sales Inventory & Days on Market Trends

The Inventory-by-Month chart is showing the low level of activity we see in the Winter Season for Closed Sales and New Listings.

The second graph shows the higher list-prices that are a logical outcome with such a low level of inventory.

Average Days on Market and Median Days on market measurements are higher in Winter but, when both are less than 60 days that is a clear sign of a hot market!

Thank you for visiting and reading our report on the Vancouver WA 98685 Real Estate Market in January 2017.  Please contact us with any questions or comments; and to let us know how we can be of assistance!


PS
- Don't wait any longer with your Selling or Buying Plans in the 98685 Zip Code - Call Us Soon!   We also offer a no-cost, no-obligation Vancouver WA 98685 Market Price Valuation, and invite you to try it out!

 PPS - You are invited to visit the 98685 Homes For Sale page at our website, where we have made Home Search  You do not have to Sign-up to view the Listed Properties!  You may also Search these Neighborhoods in 98685: Felida Homes For Sale; and Salmon Creek Homes For Sale.


The 98685 market information statistical charts in this report (prepared by Vancouver WA 98685 Listing Realtor® John Slocum, our resident statistician) are based on sales recorded in the Vancouver MLS system (RMLS) for Zip Code 98685, excluding sales of newly constructed condos; and shows the purchase activity since 2009; charting the 3 month Moving average number of sales, and the 12 month Moving average.  The "smoothing" of the relatively sparse-data helps to better illustrate the short-term and longer term trends in Vancouver's Housing market.

Disclaimer: as with all real estate statistics, we do our best to provide the best representation at the time the data was acquired.  We deem the data and reports reliable but not guaranteed.

Wednesday, February 15, 2017

Off To The Races for Vancouver WA Real Estate in 2017

Southwest Washington + Vancouver WA Real Estate Activity Arrived Early!

Traditional Real Estate Industry wisdom would say that Home Shoppers start their activity two-weeks prior to the Super Bowl weekend; while the Home Sellers came on the market about two-weeks after the Big Game. For many years this seemed reasonably true, but not these past couple of years!  Early in the month of January for both 2016, and now 2017, the lock-box openings in Southwest Washington have taken off like a rocket, rising to almost-summertime levels early in February. 

Chart of RMLS Washington Lockbox Statistics February 2017 RMLS Washington Lock-Box Activity - Week Ending 2-5-17

In fact, it appears that the level of activity in 2017 seems so far, to be stronger than in 2016.  Thus for Home Owenrs thinking of Selling, here are some recommended initial Action Items:

  • Contact us to let us help you with a Home Market Analysis and Pricing Strategy.
     
  • Your Property's Curb Appeal and Exterior Appearance + Function is Important. Items include: Trimming trees & hedges; putting down fresh bark dust; Clean Roof, Gutters, Driveway, Walkways and Deck(s).
      
  • Inside your Home - De-Clutter x 3; Pack-up Items you don't need day to day; and De-Personalize.

  • Home Repairs - get All known Electrical, Plumbing and othe Functional Items Repaired.

Eventhough the market is moving quickly, and prices are rising strongly, Proper Preparation and Presentation of your home on the First Day it hits the market will provide an Excellent Return for your efforts.  Call us for more details.

Home Shoppers / Buyers in this market environment must also be very prepared both financially and with the time-budget necessary to Act Promptly when the right home comes on the market.  We'll discuss more Home Buyer Preparation Tips in our next installment.

Thank you for visiting and reading our real estate market update for Vancouver Washington. Please feel free to contact us with any questions, or requests for assistance. 


PS - 2017's Real Estate Market is starting out strong for Vancouver WA.  If you ace planning on Selling or, just want to know what your home is worth -  we offer a no-cost, no-obligation Comparative Market Analysis for your Vancouver WA Home.  We also have on-line form to request your Home Market Analysis,,  Either way we trust you won't delay!

PPS - Now is a great time to visit our Homes For Sale Vancouver WA page, or the separate page for Condos for sale in Vancouver WA.  We've put much custom work in to make it Easy for You to search by Neighborhood or by Category, with Homes  and real estate listings from the entire RMLS.  Sign-up Not Required!

Some of the Popular Searches include:  Cascade Park Homes; The Heights Homes; Felida Homes; Fishers Landing Homes; Hazel Dell / Lakeshore Homes; Minnehaha / Walnut Grove Homes; and Salmon Creek Homes.

We also have Category searches including: Acreage Homes Vancouver WA; Listing Real Estate Agent Vancouver WA; One-Level Ranch Homes for sale in Vancouver WA.


This report and any custom charts (prepared by John Slocum Realtor®, our resident statistician) are based on home sales posted in the Vancouver MLS system (RMLS), excluding sales of mobile home; and shows the purchase activity since 2009; charting the 3 month Moving average number of sales, and the 12 month Moving average.  This "smoothing" of the trend-data helps illustrate the short-term and longer term trends in Vancouver WA's real estate market.

Disclaimer: as with any real estate statistics, we do our best to provide the best representation at the time the data was acquired.  We deem the data and reports reliable but not guaranteed.