Thursday, December 29, 2011

Home Affordability in Vancouver WA at Record High Level for Q3 2011

One of the "Gifts" the current real estate downturn has given us in Vancouver Washington and Clark County, is that the Home Affordability Index (HAI) is at a very high level.  In fact, the data provided by the Washington State University's Washington Center for Real Estate Research (WCRER) shows we are at a High not seen in at least two decades!

The Quarterly Report prepared prepared by WCRER (Third Quarter 2011 Report can be seen --> Here) is an accumulation of data by County within Washington State, allowing us here in Clark County to see how our real estate market has tracked over time; and to see how we compare to other Counties and the State Average.  The public report is only in tabular form for any given quarter, and we thought it 
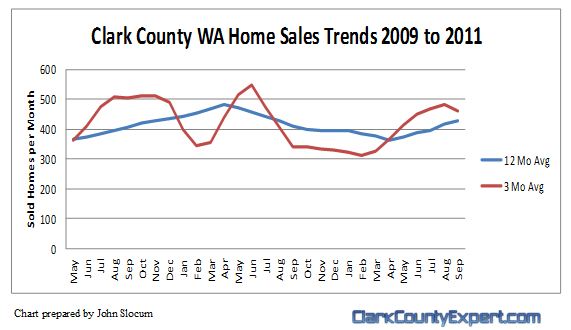
would be informative to prepare a graph, visually showing over time just how amazing the current position is.  The resulting chart below starts with the Second Quarter in 1994 through the Third Quarter of 2011:

Reading the Chart: The Housing Affordability Index (HAI) measures the ability of the Median Household Income (as currently reported by the US Census Bureau) for Clark County to purchase a Median Priced Clark County Home.  The home purchase will be made with a 20% down-payment at the current rate of interest.  A benchmark number of 100 means that the Median Household Income equally matches the requirement to purchase a Median Priced home.  Numbers above 100 mean improved Affordability; while numbers below 100 indicate decreased Affordability.

For the current heights of the HAI, we know that soft home prices and falling home loan rates have weighed in significantly.  On the Household Income measure, apparently Clark County on whole, has not had enough of a drop in income to keep the HAI from rising up.

As we can see the most recent peak in the HAI was at the time of the previous housing recession in the early 2000's.  Once that recovery turned to Boom, and then on to Bubble, the HAI dropped to it's lowest level.  Of note, even at the peak of the Bubble, the HAI for Clark County was just under the 100 benchmark level.

A Word to Wise Home Buyers: we do not expect Clark County and Vancouver WA Homes and Houses to be any more affordable than they are right now!  We've already started seeing home prices firm up, and no one expects home loan interest rates to stay below 4%.  Clark County is also more affordable than most other metro areas in Washington; and we are seeing inbound moves from the Seattle area, for example, as they take advantage of such a move!

We'd love to hear your questions or comments on this topic!

-----
The above information was assembled from data provided by the WSU Washington Center for Real Estate Research, and is deemed reliable but not guaranteed.  The chart was created by John Slocum, Broker with Vancouver WA REMAX using this data.

Wednesday, December 21, 2011

Real Estate and Home Sales Report for Clark County WA October 2011

Real Estate and Home Sales for Clark County Cool (just slightly!) for October 2011

The Autumn Season is here, and  Home Sales and real estate in Vancouver WA and Clark County cooled; Closed Volume slipped below 400 units, with the 3-month rolling average sales price turning lower again. On the positive note, Pending Sales are very strong - just under 500 units. With the strength of the Pending Sales, along with the high level of home refinancing activity occurring (to be sure, the ~4% home loan rates are causing a Refi Boom!),we see it is highly likely some of the closings that may have made it by the end of October instead, got pushed into early November.

We've previously noted the impacts to home sales in 2010 caused by the Federal Home Buyer Tax Credit -- the first half of 2010 Boomed; while the second half collapsed. The positive elements for the 2011 home buying rally have been much lower home loan rates, combined with lower home prices. Thus, Affordability for Homes in Vancouver WA is at a 25+ year high!

Now, on to our report. This information is based on home sales entered into the Vancouver MLS system (RMLS), and exclude sales of mobile homes.

For the first 10 months of 2011 we show 4,084 closed sales; compared to 4,047 for the same period in 2010. If this trend continues for the last 2 months of 2011 (and it should), we expect that 2011 will post a measurably higher sales volume what was recorded for real estate sales in 2011.

The Chart Below (prepared by John Slocum of REMAX Vancouver WA, our resident statistician) shows the purchase activity since 2009; charting the 3 month rolling average of sales, and the 12 month rolling average. This simple "smoothing" of the data better helps illiustrate the short-term and longer term trends in the Clark Conuty homes / real estate market.
Vancouver WA and Clark County Home Sales Volume Trends

The next chart below shows the Average home sales price trends (3 month and 12 month) for the same time period. As you can see, with the extended higher level of purchasing activity we are seeing some support for home sales prices, while the outlook is still "soft."
Vancouver WA Home Sales Price Trends

Lastly, the Level of Available Inventory is an important indicator of market health. We have found that a very high percentage of the "New" homes listing in the MLS are merely prospective homes to be built and thus, we have no good way to scrub out the phantom homes from the actual finished or near-finished product. Therefore, in search of a meaningful Inventory Statistic, we run the report excluding homes built in 2011. The result is our best approximation of a Resold Home Inventory calculation of 5.6 months -- a number that is substantially lower than last year, and another indication that home prices could rise with a continued higher level of demand. In contrast, the RMLS is using a a number drawing from the "New" home segment, and showing a total Inventory of 7.2 months. Clearly, removing the "new homes" that don't truly exist from our analysis provides a better reporting of this statistic.

Charts: For the enthusiasts that like to examine charts, we have the sales results for the Resold Inventory (excludes new homes) by Community that you may find helpful:

Clark County WA Home Sales Results and Charts
Battle Ground WA Home Sales Results and Charts
Camas WA Home Sales Results and Charts
La Center WA Home Sales Results and Charts
Ridgefield WA Home Sales Results and Charts
Vancouver WA Home Sales Results and Charts
Washougal WA Home Sales Results and Charts

Please let us know if you have any specific questions or comments!

Disclaimer: as with any real estate statistics, we do our best to provide the best representation at the time the data was acquired. We deem the data and reports reliable but not guaranteed.

Monday, November 7, 2011

Steamboat Landing Home Sold - Vancouver Washington

Steamboat Landing Vancouver WA -- Stratford Floorplan Home Sold!

Steamboat Landing Vancouver WA; Home Sold by John Slocum Summer 2011A favorite Columbia River Waterfront Gated Community in Vancouver Washington of ours is Steamboat Landing Vancouver WA.  We recently had the pleasure of placing our clients into a "Stratford" model -- one of the most popular floorplans in this community. 

Some of the great fetures of this home besides curb appeal include: Master and Den on the Main Level; Great Room concept with vaulted ceiling.  Given the great condition of this home, along with the desireability of this design, we quickly found ourselves in a multiple-offer situation and the listing was only a few days on the market!  Since our clients found this neighborhood and home to be their favorite, they upped-their initial offer, and literally won by the slimmest of margins.   In fact, it was so close that it came down to an All-Cash offer beating out a financed offer.

Steamboat Landing Vancouver WA; Home Sold by John Slocum Summer 2011, another viewAlthough many of the homes right on the Steamboat Landing waterfront will often be priced over $1,000,000; there will also be found a good selection of homes in the lower price ranges -- down to the mid-$200's (as of 2011, the time of this writing).   A fine Marina is also located on the river behind the gate but, owning a boat is not a requirement of owning a home here!

As one of the largest waterfront community in Vancouver, Steamboat Landing is relatively unknown by most home shoppers looking to live in Fishers Landing, Fairway Village or Cascade Park.  One of the reasons is that much of the residential real estate located between the SR-14 freeway and the Columbia River is much higher priced than much of the rest of Vancouver.  Add a gated entry to the neighborhood, and you have a combination making this place one you must "know where to look!"

Steamboat Landing Vancouver Washington; Marina by John Slocum; Summer 2011As Brokers / Realtors(r) with Remax Vancouver WA we always enjoy showing our qualified home-buyers the amenities and homes found in the Steamboat Landing!


Can you see yourself living here?  If you'd like to know about this excellent waterfront community please give us a call!  Kathryn: 360-281-4150; or, John 360-241-7232.

For a list of most of the currently available homes for sale visit Steamboat Landing Homes For Sale from the Vancouver WA MLS.

Below is a partial panorama of the Columbia River taken from the Steamboat Landing Marina:

Monday, October 31, 2011

Fairway Village Home Sold!

Home Sold in Fairway Village Vancouver WashingtonFairway Village, a Golf Course Senior 55+ Retirement Community in Vancouver Washington, is one of many neighborhoods we enjoy working with.  As Realtors with Remax in Vancouver WA it is particularly pleasing when our clients are happily placed in an updated home right on the Fairway Village golf course!


This Retirement Community is in the Southeast part of Vancouver Washington, just West of the Fishers Landing area. 


Fairway view in Fairway Village Vancouver WAAs the largest and most well known active Senior 55+ community in Vancouver, our clients had a good number of homes, mostly ranch style one-level, to choose from.  However, not all of the homes in this community are actually on the golf course.


A key point they realized when reviewing the homes, was that a location on the golf course could cost from $30,000 to $50,000 more, which has been an axiom from the inception of this development.


Fairway and Fountain view, Fairway Village Vancouver WAThe home our client's chose has many fine updates including: new flooring, paint, roof and kitchen cabinets and appliances.  All that was left is to
move in and decorate the way they wanted to!


Can you see yourself here?  If you'd like to know about this excellent active retirement community please give us a call!  Kathryn: 360-281-4150; or, John 360-241-7232.


For a list of most of the currently available homes for sale visit Fairway Village Homes For Sale from the Vancouver WA MLS:


Note: to qualify as an owner in Fairway Village, at least one of the owner-residents must be 55 in age or older, and all permanent occupants of the home must be over 18.

September Home Sales Report for Clark County and Vancouver Washington

Clark County Home Sales Rally of 2011 Continues with a Good Showing in September

From the beginning of 2011, Homes and Real Estate Sales volume in Vancouver WA and Clark County have shown regular improvement, either on a month-over-month basis; or, when compared to the same results in 2010.  However, sales prices have taken a while to respond but, have finally done so in a positive manner.

One very important consideration we must take care of early is the impact the Federal Home Buyer Tax Credit had on the sales volume and prices during 2010, and perhaps into 2011.  With the eligibility for the tax credit expiring in the first half of 2010, we saw many home shoppers move up their purchases from just a few months, and on up to a year sooner for others.  This created an
artificially higher volume of sales in early 2010; high enough to provide support for the otherwising falling home values; along with a much lower volume of sales for the six or more months following the expiry.

When the tax credit incentive were in-place, homes purchased effectively cost less to the eligible purchaser.  Last Summer,the removal of the Incentive caused home prices to fall so that home prices are now Less; probably so much lower that it may be that those who waited until this year obtained a much better net price.

That said, on to our report.  This information is based on home sales entered into the Vancouver MLS system (RMLS), and exclude sales of mobile homes.

For the first 9 months of 2011 we show 3,702 closed sales; compared to 3,722 for the same period in 2010.  If this trend continues for the last 3 months of 2011 (and it should), we expect that 2011 will post a higher sales volume than in 2011.

The Chart Below (prepared by John Slocum, our resident statistician) shows the purchase activity since 2009; charting the 3 month rolling average of sales, and the 12 month rolling average.  This simple "smoothing" of the data better helps illiustrate the short-term and longer term trends in the Clark Conuty real estate market.

Vancouver WA and Clark County Home Sales Volume Trends
The next chart below shows the Average home sales price trends (3 month and
12 month) for the same time period.  As you can see, with the extended
higher level of purchasing activity we are finally seeing some support building
in the past 3 months for home sales prices.

Vancouver WA Home Sales Price Trends

One final statistic we'll discuss here is the Inventory Level.  We find that a very high percentage of the "New" homes listing in the MLS are merely prospective homes to be built and thus, we have no good way to scrub out these "phantom homes" from the actual finished or near-finished product. 
Therefore, in search of a meaningful Inventory Statistic, we run the report excluding homes built in 2011.  The result is our best approximation of a Resold Home Inventory calculation of 5.8 months -- a number that is substantially lower than last year, and another indication that home prices could rise with a continued higher level of demand.

Please let us know if you have any specific questions or comments!

Disclaimer: as with any real estate statistics, we do our best to provide the best representation at the time the data was acquired.  We deem the data and reports reliable but not guaranteed.

Wednesday, August 10, 2011

Real Estate Camas WA | Market Statistics and Trends June 2011


Camas Washington Real Estate
- A HOT Month in June.

Camas Home Sales knocked a couple out of the park with Pending Home Sales increasing 27% while Active listings decreased by about 15%!

Earlier this month we've logged into the Camas MLS to identify what direction the real estate market is heading. Here are the key statistics we have to report:
Camas WA Real Estate Market Report, including Camas USA Zip Code 98607 for May 2011 by John Slocum of REMAX Vancouver WA
From this quick look at the home sales action we see 14.9% fewer Active listings, with relatively strong numbers for Pending and Closed Sales. Additionally, we see the distressed property category moving down to26.3% of the existing inventory (27.1% the prior month).

The table below shows the RMLS market data for the transactions within the Camas
Zip code of 98607.

Camas Real Estate Market Data May 2011

Since Camas is a relatively small area with a reasonably wide mix of home sales prices, the "Average Home Sales Price" can vary quite a bit when looking at a month-over-month comparison.

The short term tabulations for Days on Market are showing most homes are selling much more quickly!

The Chart Below compares current Camas Washington Home Sale Prices and Listing Trends; Average and Median Prices; and Days On the Market, over the past 36 months:

Real Estate Camas WA Price and Volume Trends for Listings and Sales

Looking to purchase a home in Camas? -- now is an opportune time! Camas is located on the north shore of the Columbia River in Washington State, and features a relatively mild climate and excellent economic base (btw - there is no personal State or Local Income Tax in Camas!). Our featured neighborhood this month:

Homes For Sale in Prune Hill Camas WA
,
-------
Disclaimer: this information is drawn using custom search parameters from the predominant MLS system covering Camas Washington deemed reliable but not guaranteed to be accurate.
Current Vancouver WA Real Estate Market Reports:
Previous Vancouver WA Real Estate Market Reports:


The above information was provided by John Slocum and Kathryn Alexander, recognized as one of the top teams at REMAX Camas WA . We hope you enjoy the information in our posts, including videos on real estate and Homes for sale in Camas Washington and the rest of Clark County.


Thinking of selling your home in this market? We have the insight and passion for selling homes to get you moving!

PS - Nobody sells more homes than RE/MAX. Look to the Alexander ~ Slocum Team for your Homes for Sale Camas WA, Homes for sale Vancouver WA and Real Estate Vancouver WA!

Vancouver WA Homes for sale: Visit ClarkCountyExpert.com to explore real estate in Vancouver Washington!

Monday, August 8, 2011

Real Estate Battle Ground WA | Market Statistics and Trends June 2011

Battle Ground WA Real Estate Another Good Month of Home Sales

Home Sales volume remained at a reasonably high level in Battle Ground, with closings down 6 units and an improved Distressed/Total Ratio posted for Pending Sales...

Earlier this month we checked in with the Battle Ground MLS to see what happened with the real estate statistics and trends within the confines of the Battle Ground zip code 98604, for June. Here is the breakdown by Active | Pending | Sold; and further broken down by 3rd Party/Pre-Foreclosure | Foreclosures:
Battle Ground Washington Real Estate Market Report by John Slocum & Kathryn Alexander REMAX Battle Ground WA
From this quick view we see a decrease of 1 units for Pending Sales, and another welcome Decrease in the proportion of distressed properties to total inventory. This month the 3rd Party + Pre-Foreclosures + Foreclosures combined are about 27.8% of the Active homes listed (29.4% last month), and they represent about 32.4% of the homes going under contract (39.5% last month; and
61.1% in March).
Home prices in Battle Ground have been showing good strength as well, with the average sold-price moving up to $234,922 in June!
The table below is from the RMLS, showing the past 3 months of activity (you may right-click on the image and follow your browser's instructions to view the Full-Sized image)

Market Statistics and Trends for Battle Ground June 2011
The Key items we are looking for in a market turnaround are not just an increase in the number of transactions but, a decrease in the non-Pre-Foreclosure / Foreclosure Sold category. In our opinion that ratio has continued to show improvement in June, and if the relative price-strength remains, there is a good environment for recovery.

The Chart Below compares Battle Ground Home Sale Prices  by AVERAGE and MEDIAN, in addition to Sales Volumes and Days On Market for the past 36 months:

Real Estate Battle Ground WA Market Price Chart for Year to date 2011


Clearly Battle Ground home sales prices been within a rather narrow range for the past year -- which is a very positive sign of Base Building.  We are also see a substantial reduction in the Days-On-Market statistic!

If you are looking to sell your home in Battle Ground, Vancouver or another part of Clark County Washington in this challenging market time please call or e-mail us with the details of your situation and we'll customize a marketing plan to get your Battle Ground Home Sold!

-------

Disclaimer: this information is drawn using custom search parameters from the predominant MLS system covering Vancouver Washington and is not guaranteed to be accurate.
Current Vancouver WA Real Estate Market Reports:
Previous Vancouver WA Real Estate Market Reports:

The above information was provided by John Slocum and Kathryn Alexander, recognized as one of the top teams at Vancouver WA REMAX . We hope you enjoy the information in our posts, including videos on real estate and Homes for sale in Vancouver Washington and the rest of Clark County.

Thinking of selling your home in this market? We have the insight and passion for selling homes to get you moving!

For Southwest Washington homes and Real Estate in Vancouver WA visit Real Estate
in Vancouver WA
. If your interest is in foreclosures, pre-foreclosures (short sale homes) ; and when looking for Bank Owned Homes in Vancouver Washington we have our website set up for you to easily search for each of these categories!

PS - Nobody sells more homes than RE/MAX. Look to the Alexander ~ Slocum Team
for your Vancouver WA real estate!
These are other popular recent searches on our website:

Camas Washington Real Estate
Luxury Homes in Vancouver WA


Homes For Sale Vancouver WA

Vancouver WA Homes for sale: Visit ClarkCountyExpert.com to explore real estate in Vancouver Washington!

Saturday, August 6, 2011

Real Estate Vancouver WA | Market Statistics and Trends for June 2011

Homes For Sale in Vancouver WA Are Still in a Positive Buying Trend...

Real Estate in Vancouver WA for the second straight Quarter has seen excellent action with short-term trend for Closed Sales still above the 12-month trend; with another modest decrease in the total Active listings. Average home sale prices are edging lower as much of the action is in the lower end of the market (the highest-priced home sold this month was $600,000). We are still working through a relatively large segment of inventory in the Distressed Property categories.

Of the single-family houses and condos for sale that went Pending in June, we saw both the Short Sales and the Bank Owned Homes segments capturing 31.3% of the market; a substantially lower number than last month's 41.7%; (much lower than December's 61.0% of the total Pending Sales).
The chart below is a matrix representation of the highlights for homes for sale in Vancouver, WA
June 2011:
Vancouver WA Real Estate Market Report, including All Vancouver USA Zip Codes for June 2011 by John Slocum of REMAX Vancouver WA
With the level of Active homes showing a slight decrease, and the volume of Pending Sales
staying at a strong level, we estimate the adjusted inventory available at just over 5 months worth. The table below shows the most recent three months of activity for comparison purposes (right-click on the image to see the enlarged view).

Vancouver WA Real Estate Market Trends for June 2011, John Slocum Realtor Broker Agent with REMAX Vancouver WA

The Charts below shows the past 12 months trend of home prices and sales volume for Vancouver WA. For home prices to start going up, we will typically first see a meaningful AND sustained increase in the number of homes purchased in both Vancouver and the other major Pacific Northwest cities, with a clearing out of the damaged and distressed homes; combined with a revival of the sales in the upper-end. Although there had been increases in home buying activity for the past two quarters, we are cautious about the results to expect for this summer with respect to the "Average Sales Price."

Vancouver WA Real Estate Market Chart by  John Slocum and Kathryn Alexander of REMAX Vancouver WA


In our opinion we have positive improvement in several areas: including a Decrease in the relative
weight of the Distressed Properties; and Improved Volume these past two Quarters. In response to RMLS and newspaper reports discussing lower sales volumes for 2011 both of these outlets Fail to mention that last year the Federal Home Buyers Tax Credit incentive was in full swing, which very much distorted any such comparisons. Thus, we are somewhat bullish on the current trends when the tax credit stimulus is discounted from the comparison.

If you are looking to sell your home in Vancouver WA, and Clark County Washington in this Opportunity Market please call or e-mail us with the details of your situation and we'll customize a marketing plan to get your Clark County Home Sold!

Some of the major parts of town you may want to look for include Homes
for sale in Downtown Vancouver
, The Heights Homes, Orchards Homes, Cascade Park Homes, Fishers Landing Homes For Sale, Evergreen Homes, Hazel Dell Homes For Sale , Felida Homes and Salmon Creek Homes.
The largest city in Clark County WA is Vancouver Washington. Other towns include: Amboy, Battle Ground, Brush Prairie, Camas, Ridgefield, Washougal, parts of Woodland and Yacolt.
-------

Disclaimer: this information is drawn using custom search parameters from the predominant MLS system covering Vancouver Washington and is not guaranteed to be accurate.
Current Vancouver WA Real Estate Market Reports:
Previous Vancouver WA Real Estate Market Reports:


The above information was provided by John Slocum and Kathryn Alexander, recognized as one of the top teams at Vancouver WA REMAX . We hope you enjoy the information in our posts, including videos on real estate and Homes for sale in Vancouver Washington and the rest of Clark County.

Thinking of selling your home in this challenging market? We have the passion and insight for selling homes to get you moving!

For Southwest Washington homes and Real Estate in Vancouver WA visit Vancouver WA Real Estate. If your interest is in foreclosures, pre-foreclosures (short sale homes) ; and when looking for Bank Owned Homes in Vancouver Washington we have our website set up for you to easily search for each of these categories!
PS - Nobody sells more homes than RE/MAX. Look to the Alexander ~ Slocum Team
for your Vancouver WA real estate!
These are other popular recent searches on our website:

Camas WA Real Estate
Luxury Homes Vancouver WA
Vancouver WA Homes for sale: Visit ClarkCountyExpert.com to explore real estate in Vancouver Washington!

Thursday, August 4, 2011

Real Estate Clark County WA | Market Trends and Statistics for June 2011

Home Sales Show Another Strong Month for Vancouver and Clark County Washington in June.

Real Estate Sales in Clark County and Vancouver WA has advanced again with Pending Sales edging up another 2 units over last month, the previous high so far in 2011.  The relative mix of 3rd-Party and Distressed properties also edged slightly lower from 40.%  to 31.8% of the total Pending Sales for June.

The Data we are using the Vancouver MLS (covers Clark County Washington also) to obtain a
comprehensive view of what happened real estate sales wise within the confines of Clark County Washington (Vancouver USA is the largest community) for the month of June.
The chart below is the condensed version we have prepared from Vancouver MLS data:
Vancouver WA Real Estate Market Report, including Clark County WA for June 2011 by John Slocum of REMAX Vancouver WA
This month the level of Active homes is showing a modest decrease of 6.9%, with the volume of Pending Sales remaining quite strong. An important point to remember when viewing this information in light of the local newspaper reports, is that this year we do not have a Federal Home Buyer Tax Credit Incentive driving home sales like there was last year.  The sales this market is achieving are based upon better pricing and transaction terms.  The table below shows the most recent three months of activity for comparison purposes. Both the median price and average price showed slight slippage which is customary and expected in the early phase of a market recovery (right-click on the image to see the enlarged view).

Vancouver WA Real Estate Market Trends for June 2011, John Slocum Realtor Broker Agent with REMAX Vancouver WA

From this quick view we have a decrease to 6.7 months inventory; although from our
Mid-Year 2011 Clark County Real Estate Market Report
this number must be adjusted downward to 5.17 months to account for "New Homes" listings where the house has not been built; and for Short Sale listings with offers on them.  This is an important trend we want to watch in the supply of
homes for sale in Vancouver WA
over the next several months.

For this month the Average Sold price is $180,233 - down from $192,105 the prior month; while the Median Sales Price dropped to  $163,500.   Again, this is a common It is our observation that the lower-end properties are seeing strong activity at the moment.

These final charts graphically represent the home sales results for Clark County and Vancouver WA in summary form:

Home Sales Results for Clark County and Vancouver WA

The important items we are looking for the Clark County market turnaround are not just an increase in the number of transactions and firming-prices but, an increase in the "Normal Sale" (i.e., non-Pre-Foreclosure / Foreclosure) Category. In our opinion with about 40.3% of the Pending status homes being 3rd party or Foreclosure transactions (another monthly decrease), we view this as a very positive trend.  Prices have been drifting downward, which in the early phase of a recovery is very common, and is also a sign of damaged and rehabbed properties being cleared out of the mix.

If you are looking to sell your home in Vancouver WA, and Clark County Washington in this challenging market time please call or e-mail us with the details of your situation and we'll customize a marketing plan to get your Clark County Home Sold!

The largest city in Clark County WA is Vancouver Washington. Other towns include: Amboy, Battle Ground, Brush Prairie, Camas, Ridgefield, Washougal, parts of Woodland and Yacolt.
-------
Disclaimer: this information is drawn using custom search parameters from the predominant MLS system covering Vancouver Washington and is not guaranteed to be accurate.
Current Vancouver WA Real Estate Market Reports:
Previous Vancouver WA Real Estate Market Reports:

The above information was provided by John Slocum and Kathryn Alexander, recognized as one of the top teams at REMAX Vancouver WA. We hope you enjoy the information in our posts, including videos on real estate and Homes for sale in Vancouver Washington and the rest of Clark County.

Thinking of selling your home in this market? We have the insight and passion for selling homes to get you moving!

Visit our website to learn more about Vancouver Washington, Camas real estate or Battle Ground real estate.


PS - Nobody sells more real estate than RE/MAX. Look to John Slocum and Kathryn Alexander for Vancouver WA Homes For Sale


Vancouver WA Homes for sale: Visit ClarkCountyExpert.com to explore real estate in Vancouver Washington!


For your Smart Phone and Tablet PC Home Search visit:


Search for Homes for sale in Vancouver WA with your Smart Phone or Tablet PC

Sunday, July 3, 2011

Real Estate La Center WA | Market Statistics and Trends May 2011

Real Estate La Center Washington, Market Statistics and Trends for May 2011

La Center home sales again eased slightly  (March's pace was quite brisk)...

La Center is the smallest market area we cover in our monthly reports; and with such a small size, a deviation of just a few home sales can make a very large percentage difference.  Thus, for this area it is important to also view both the longer term context for La Center, and view the overall Clark
County Real Estate scene as well.

Earlier in May we logged into the MLS for Vancouver and La Center to obtain a quick snap-shot view of what happened with real estate and home sales within the confines of La Center, in Clark County Washington for May 2011. Here is what we have to report:
La Center Washington Real Estate Market Report by John Slocum & Kathryn Alexander REMAX Vancouver WA
From this quick view we see 2 fewer Pending transactions and 5 more Solds when compared to April, as well as about four-and-a-half month's supply of inventory available at the end of the month. This month the 3rd Party + Pre-Foreclosures + Foreclosures combined are about 37.0% of the Active homes listed (a slight increase from last month), and only represent 33.3% of the homes Pending this month.

The table below shows the key activity indicators for the past three months in La Center
(right-click your mouse when over this image and follow your browser's instructions to view larger size image):

La Center WA Real Estate Statistics and Trends

Key items we are looking for in a market turnaround are not just an increase in the number of transactions but, an increase in the "Normal Sales" category. County-wide we have seen a continued high level in the number of 3rd Party + Bank Owned homes going Pending, relative to the total number of homes going pending.

The short-sale banks are becoming more pro-active in approving Short Sales -- We believe
this will continue as our local market heals at this stage of the Recovery.

The Chart Below compares La Center Washington Home Sale Prices  over the past 12 months:

Real Estate Market Chart by John Slocum and Kathryn Alexander of www.ClarkCountyExpert.com


From the above pricing chart, La Center Home Prices have clearly been improving most of this Winter quarter, with softness in March with improvement in May.

If you are looking to sell your home in La Center, Vancouver or another part of Clark County Washington in this challenging market time please call or e-mail us with the details of your situation and we'll customize a marketing plan to get your Clark County Home Sold!
-------
Disclaimer: this information is drawn using custom search parameters from the predominant MLS system covering Vancouver Washington and is not guaranteed to be accurate.
Current Vancouver WA Real Estate Market Reports:
Previous Vancouver WA Real Estate Market Reports:

The above information was provided by John Slocum and Kathryn Alexander, recognized as one of the top teams at REMAX Vancouver WA. We hope you enjoy the information in our posts, including videos on real estate and Living in Vancouver Washington and the rest of Clark County.

Thinking of selling your home in this market? We have the insight and passion for selling homes to get you moving!

For Southwest Washington homes and Real Estate in Vancouver WA visit Real Estate Vancouver WA. If you have an immediate need to search the MLS for Vancouver WA please visit Vancouver WA Homes For Sale , and Homes For Sale in La Center WA.

If your interest is in foreclosures, pre-foreclosures (short-sale homes) and Bank Owned Homes in Vancouver WA we have a special search set up for you at Vancouver WA Bank Owned Homes For Sale.

Vancouver WA Homes for sale: Visit ClarkCountyExpert.com to explore real estate in Vancouver Washington!

Real Estate Ridgefield WA | Market Statistics and Trends for May 2011

Real Estate Ridgefield WA | A Dynamite Month for May 2011

Ridgefield WA Home Sales show strong improvement in May, with Short Sales and REO's a shrinking part of the mix...

Ridgefield Washington was one of the earliest and hardest hit areas for distressed properties (foreclosures and short sales) in Clark County, and is now showing significantly higher ratios of normal sales vs. distressed property sales when compared to the County overall. We have observed more new-home construction and sales occurring, which is another clear sign of improvement for Ridgefield.

We've logged into the MLS for Vancouver and Ridgefield to obtain a quick snap-shot view of what happened during May with Home and Condo sales within the confines of the Ridgefield zip code 98642, in Clark County Washington. Here is what we have to report:
Ridgefield Washington Real Estate Market Report by John Slocum & Kathryn Alexander REMAX Ridgefield WA
From this brief view we see that the number of Pending transactions this month increased by almost 65% when compared to last month; as well as about six (6) month's supply of inventory (based on
Solds) available at the end of the month. This month the 3rd Party + Pre-Foreclosures + Foreclosures combined are about 23.6% of the Active Ridgefield homes listed for sale (still much lower than the County Average and a slight increase from last month), yet they represent about 17.9% of the homes going under contract (a welcome decrease from 31.6% last month!).

The table below is the last 3 months of activity from the Ridgefield MLS (right-click on the image and follow your browser's instructions to see the full-size image).

Ridgefield WA real estate market trends and statistics

The Chart Below shows Ridgefield Washington Home Sale Prices and Trends over the past 12 months, comparing Average and Median Sales prices compared to List prices (April looks good for firmed-up prices!):

Real Estate Market Chart by John Slocum and Kathryn Alexander of www.ClarkCountyExpert.com

If you are looking to sell your home in Ridgefield, Vancouver or another part of Clark County Washington in this challenging market time please call or e-mail us with the details of your situation and we'll customize a marketing plan to get your Clark County Home Sold!
-------
Disclaimer: this information is drawn using custom search parameters from the predominant MLS system covering Vancouver Washington and is not guaranteed to be accurate.

Current Vancouver WA Real Estate Market Reports:
Previous Vancouver WA Real Estate Market Reports:

The above information was provided by John Slocum and Kathryn Alexander, recognized as one of the top teams at REMAX Vancouver WA. We hope you enjoy the information in our posts, including videos on real estate and Living in Vancouver Washington and the rest of Clark County.

Thinking of selling your home in this market? We have the insight and passion for selling homes to get you moving!

For Southwest Washington homes and Real Estate in Vancouver WA visit Real Estate Vancouver WA. If you have an immediate need to search the MLS for Vancouver WA please visit Homes For Sale Vancouver WA , and Real Estate Ridgefield WA.

If your interest is in foreclosures, pre-foreclosures (short-sale homes) and Bank Owned Homes in Vancouver WA we have a special search set up for you at Bank Owned Homes Vancouver WA.


Vancouver WA Homes for sale: Visit ClarkCountyExpert.com to explore real estate in Vancouver Washington!

Saturday, July 2, 2011

Real Estate Washougal WA | Market Statistics and Trends May 2011

Real Estate Washougal Washington, Market Statistics and Trends for May 2011

Washougal Real Estate maintained the higher pace this month, with a continued lowering in the overall level of Inventory...

Earlier in May we logged into the MLS for Vancouver and Washougal to obtain a quick snap-shot view of what happened with Washougal WA Real Estate market trends and statistics, in Clark County Washington 98671. Here is what we have to report:
Washougal WA Real Estate Market Report, May 2011, by John Slocum & Kathryn Alexander REMAX Washougal WA
From this quick view we see the Same Number Pending transactions compared to last month
(April had a modest increase while March had a 50% increase!), and about a six month's supply of inventory available at the end of the month (projected based upon Pending Homes). This month the 3rd Party + Pre-Foreclosures + Foreclosures combined are still running at a slightly lower, but still high level, although we are starting to see within that mix a continuing new dominance of short-sales vs. foreclosures being sold.

This next Table shows the sales activity for the past 3 months in Washougal from the MLS
(you may right-click on the image and follow your browsers instructions to see the larger image):

Washougal Real Estate Market Treand and Statistics for May 2011


The Chart Below shows Washougal Washington Home Sale Prices and Inventory Trends over the past 12 months.

Washougal WA Real Estate and Homes Price Trend

The Price Trend for Washougal Homes and Real Estate suggests the market has been doing well with the absorption of the distressed properties, although we are a little behind time-wise in seeing the seasonal firming up in prices.

If you are looking to sell your home in Washougal, Vancouver or another part of Clark County Washington in this challenging market time please call or e-mail us with the details of your situation and we'll customize a marketing plan to get your Clark County Home Sold!
-------
Disclaimer: this information is drawn using custom search parameters from the predominant MLS system covering Vancouver Washington and is not guaranteed to be accurate.

Current Vancouver WA Real Estate Market Reports:
Previous Vancouver WA Real Estate Market Reports:

The above information was provided by John Slocum and Kathryn Alexander, recognized as one of the top teams at REMAX Vancouver WA. We hope you enjoy the information in our posts, including videos on real estate and Living in Washougal Washington and the rest of Clark County.

Thinking of selling your home in this market? We have the insight and passion for selling homes to get you moving!

For Clark County Washington homes and Real Estate in Vancouver WA visit Vancouver WA Real Estate. If you have an immediate need to search the MLS for Vancouver WA please visit
Homes For Sale Vancouver WA
.

If your interest is in foreclosures, pre-foreclosures (short-sale homes) and Bank Owned Homes in Vancouver Washington we have a special search set up for you at Bank Owned Homes Vancouver WA.

Vancouver WA Homes for sale: Visit ClarkCountyExpert.com to explore real estate in Vancouver Washington!

Friday, July 1, 2011

Real Estate Camas WA | Market Statistics and Trends May 2011

Camas Washington Real Estate - Getting Back on Track for May.

Camas Pending Home Sales increased 12% from April's lower results however, Active listings increased by about 23%, with a slight decrease in the overall volume of distressed properties in the Active Inventory.

Earlier this month we've logged into the Camas MLS to identify what direction the real estate market is heading. Here are the key statistics we have to report:
Camas WA Real Estate Market Report, including Camas USA Zip Code 98607 for May 2011 by John Slocum of REMAX Vancouver WA
From this quick look at the home sales action we see 22.9% more Active listings. Additionally, we see the distressed property category moving down to 27.1% of the existing inventory. However, the 3rd Party + Pre-Foreclosure Pending Sales reversed last month's dip, with a good number of short sales going Pending.

The table below shows the RMLS market data for the transactions within the Camas
Zip code of 98607.
Camas Real Estate Market Data May 2011

The Chart Below compares current Camas Washington Home Sale Prices and Listing Trends over the past 12 months:

Real Estate Camas WA Price and Volume Trends for Listings and Sales

Looking to purchase a home in Camas? -- now is an opportune time! Camas is located on the north shore of the Columbia River in Washington State, and features a relatively mild climate and excellent economic base (btw - there is no personal State or Local Income Tax in Camas!). Our featured neighborhood this month: Homes For Sale in Lacamas Shores Camas WA,

-------

Disclaimer: this information is drawn using custom search parameters from the predominant MLS system covering Camas Washington deemed reliable but not guaranteed to be accurate.

Current Vancouver WA Real Estate Market Reports:
Previous Vancouver WA Real Estate Market Reports:


The above information was provided by John Slocum and Kathryn Alexander, recognized as one of the top teams at REMAX Camas WA . We hope you enjoy the information in our posts, including videos on real estate and Homes for sale in Camas Washington and the rest of Clark County.


Thinking of selling your home in this market? We have the insight and passion for selling homes to get you moving!

PS - Nobody sells more homes than RE/MAX. Look to the Alexander ~ Slocum Team
for your

Homes for Sale Camas WA
, Homes for sale Vancouver WA and
Real Estate Vancouver WA
!

Vancouver WA Homes for sale: Visit ClarkCountyExpert.com to explore real estate in Vancouver Washington!