Home Sales Surge Ahead in January 2016 for Vancouver WA !
- 283 Resale Homes were sold in January 2016, which is 26 (10.1%)
more homes than were sold in January 2015.
- The 3-Month Moving Average Price Trend Line is moving very slightly
upward - at a level now
up 10.01% over the prior year at $270,265; and the 12-Month Moving Average up 8.63%, and now at
$266,310.
- Short Sale /Pre-Foreclosure property sales were only 7 units (2.5% of total);
which is a substantial decrease when compared to 17 (6.6% of total) in January of 2015.
- REO/Bank Owned home sales were 14 units (4.9% of total); quite a decrease
from 25 (9.7% of total) in January of 2015.
- Available Inventory for Resale Homes at the end of January has been shrunk again sitting now at 0.9 Months of Supply!
The historically low interest rates are also another strong factor in allowing home-buyers to qualify for a purchase and to purchase a more expensive property than they might have been able to afford..
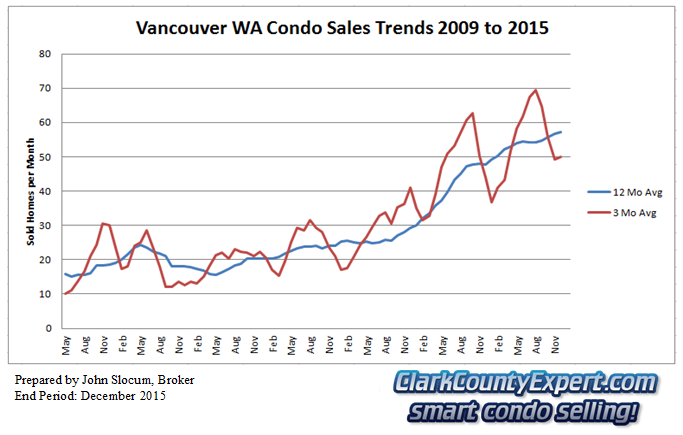
The charts we have prepared below show the most recent action in Vancouver's market for pre-owned Homes, and how far this market has changed since 2009.
 Vancouver WA Resale Home Sales - Units Sold Trend January 2016
Even though the unit-volume is much higher this January than in previous years at the same time we are still seeing the seasonal "waviness" to the 3-month (short-term) trend line. The longer-term trend line (1-year) is showing a smooth and rather modest increase for almost 2 years running.
For Average Sales Prices, the short term and long term trends are shown below. This season the typical "downturn" is more like a "pause" in the more general up-trend; as shown by the short-term trend (in red); with the long-term trend-line keeping about the same slope to its upward direct.
 Vancouver WA Resale Home Sales - Average Sales Price Trend
52 properties (18.37%) closed at $200,000 or less when sold; with 105 (37.1%) sold that were priced $200,000 to $250,000. In comparison with the 2014 measurement, 70.0% of the January 2015 sales were at $250k or below; while this January that reading is now at 59.9%.
These last three charts (below) from the Regional Multiple Listing Service show the most recent 12 months real estate market action for Unit Sales, Average & Median Prices; and Days on Market:
 Vancouver Resale Home Sales Inventory & Days on Market Trends
Of note this month is the big jump in the Average List Price (yellow-bar in middle chart). Does this portend a similar jump in the ultimate sales price? Stay tuned and we shall see!
Thank you for viewing our report, and please contact us with any questions, comments or requests for assistance.
PS - You are welcome to visit our
Homes For Sale in Vancouver WA page. We've tried hard to make it Easy
for You to search by
Neighborhood or by Category, with Homes and real estate listings from the entire
RMLS. Sign-up Not Required!
Some of the Popular Searches include: Cascade Park Homes; The Heights Homes; Felida Homes; Fishers Landing Homes; Hazel Dell / Lakeshore Homes; Minnehaha / Walnut Grove Homes; and Salmon Creek Homes.
A few of the Category searches include: Acreage Homes Vancouver WA; Vancouver WA Real Estate Listing Agents; One-Level Ranch Homes for sale in Vancouver WA.
PPS -2015 has broken records for the Vancouver Washington real estate market. Do You Have Home Selling or Buying Plans this Winter/Spring Season? - Call Us Right Away!
This report and custom charts (prepared by John Slocum Realtor®, our resident statistician) are based on home sales posted in the Vancouver MLS system (RMLS), excluding sales of mobile home; and shows the purchase activity since 2009; charting the 3 month Moving average number of sales, and the 12 month Moving average. This "smoothing" of the trend-data helps illustrate the short-term and longer term trends in Vancouver WA's real estate market.
Disclaimer: as with any real estate statistics, we do our best to provide the best representation at the time the data was acquired. We deem the data and reports reliable but not guaranteed.