Friday, October 19, 2018

Clark County WA Real Estate Market Report - September 2018

Real Estate Sales Slowing Sharply in Clark County WA for September 2018.

Sales of existing homes has been taking a big hit of late, with this month's tally for Units-sold down a whopping 109 units compared to the same month last year! Here are the key highlights for this month: 

  • Average-Sales Prices are starting to fall, although still in positive territory with the 12-month/long-term trend line up 9.94% compared to last year at this time;  and the 3-Month Moving Average is up 7.77% from September last year; 
     
  • The Inventory for Resale Homes slipped to 2.2 Months Supply;
     
  • Approximately 527 Resale Homes closed in the month, which is about 109 fewer (-17.1%) homes than in 2017; and 154 fewer than last month.
     
  • REO/Bank Owned property sales were 3 units (0.6% of total); down from 10 (1.6%) in 2017. 
     
  • Short Sale /Pre-Foreclosure property sales were 2 units (0.4% of total); no change from 2 (0.3%) in 2017.

The month-end, 30-year-fixed home loan benchmark interest rate is 4.63% (up slightly from 4.55% last month) according to Freddie Mac; compared to 3.81% for September 2017.

The Unit-Volume chart shows both the short term (in red) and long term (12-month moving average in Blue) trends (shown below): 

Clark County Home Sales September 2018- Units Sold Clark County Home Sales - Units Sold Trend September 2018

With both trend-lines clearly moving lower from the peak seen in the past two years, the local market is looking for a new equilibrium.  With prices still rising at a pace above the long-term average, we still seem to be in a position of short-supply with respect to Buyer-Demand.

The next chart shows the trends for Average Home Sales Price, both the short-term and long-term: 

Clark County Home Sales September 2018- Average Sales Price Trends Clark County Home Sales - Average Sales Price Trend September 2018


The September short term Average sales price for Clark County is now up to $399,010; but down slightly from last month. This represents an increase of approximately $28,751 from the same month last year.

Our last set of graphs from RMLS show:

Charts of Vancouver WA Home Sales Trends in September 2018 Clark County Home Sales Inventory
& Days on Market - September 2018


New Listings, Pending Sales and Closed Sales all came in lower. Active Inventory however, eased slightly. 

The second graph with Prices for new listings and closed sales are still at a relatively high price level. 

Days on the Market: the Average dropped by several days; with the Median increasing by a few days. Both are in the zone we typically see week - again, very uncharacteristic for one of the usually best sales months of the entire year.

If you are interest the RMLS published report on the Clark County real estate scene can be found here: RMLS Market Action Report on our main website.


PS - The real estate market is adjusting to the much higher prices combined with higher loan costs however, there is still time to List and Sell Your Home with Our Team for 2018; or, at least find out what your home is worth!  We offer a no-cost, no-obligation Clark County WA Home Valuation, and invite you to try it out!

PPS - Looking to buy a home this year?  Interest rates are still at historically very low rates.  You are invited to visit our web-page for Clark County WA  Homes For Sale where it is Quite Easy to search by City, Neighborhood or by Category, with homes and real estate listings from the entire RMLS.  Sign-up Not Required!  The property and home listings shown are provided via many updates each day, and you will be e-mailed hourly with any new matches once you've signed up for a home search.

We also have the MLS Listings for these great towns in Clark County:  Battle Ground WA Real Estate | Brush Prairie WA Homes | Camas WA Homes For Sale | Hockinson WA Homes | La Center WA Homes for sale | Ridgefield WA Homes for sale | Homes for sale in Vancouver Washington | Washougal WA Real Estate | Yacolt WA Homes | Amboy WA Homes


The information and charts in this Clark County WA real estate update (prepared by Vancouver WA Real Estate Broker, John Slocum, CRS, SFR, our resident statistician) are based on home sales recorded in the Clark County WA MLS system (RMLS), excluding sales of mobile home; and shows the purchase activity since 2009; charting the 3 month Moving average number of sales, and the 12 month Moving average.  This "smoothing" of the trend-data helps illustrate the short-term and longer term trends in Clark County's real estate market.

Disclaimer: as with any real estate statistics, we do our best to provide the best representation at the time the data was acquired and compiled.  The data and reports are deemed reliable but not guaranteed.

Tuesday, October 9, 2018

Camas WA Home Sales - August 2018

Home Sales Post Strong Results for Camas WA in August 2018

Camas WA Home Sales continue to run counter to the overall Clark County unit-volume results.  Available Inventory has stopped increasing, and actually shrank modestly. Here are the August 2018 highlights:
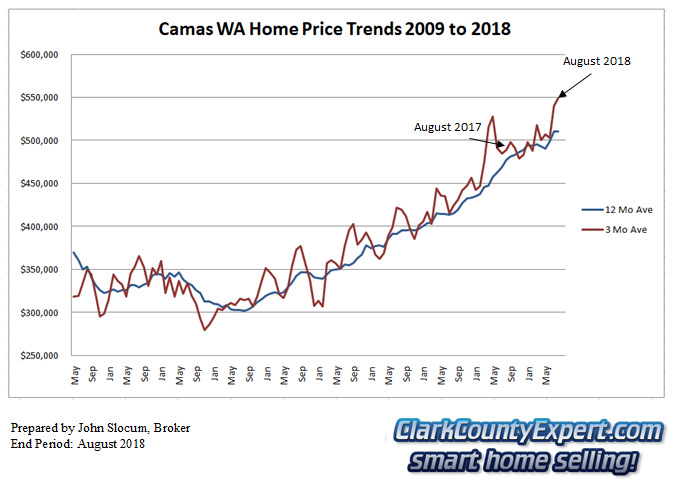
  • The Short-Term Average Price Trend is up with the 3-Month Moving Average at 12.38% from the year before; while the 12-Month Moving Average is up 6.93%
     
  • The Inventory level had been increasing but now retreated to 2.6 months for Resale Homes.   
     
  • Approximately 55 Resale Homes closed in August 2018, compared to 57 Sold in 2017; which is 2 (-3.5%) fewer than in 2017, and 8 fewer than last month;
     
  • REO/Bank Owned property sales were 0 units (0% of total); down from 1 (1.8%) in 2017. 
     
  • Short Sale /Pre-Foreclosure property sales were 0 units (0% of total); no change from 1 (1.8%) in 2017.
The short-term Average Sales Price continued to move up, finishing the month at $549,019; which is about $60,489 more than the same measure in 2017. This average price is 39.33% higher than the Clark County average. 
The action in the Unit-Volume is shown in the chart I've prepared below:

Camas Resale Home Sales August 2018 - Units Sold Camas Resale Home Sales - Units Sold Trend August 2018

Another good month, unit-volume wise, has helped Camas home sales reverse the downward long-term trend that had started a couple of years ago for this small town.

We also have the Average Closed Sales Prices (chart below) continuing to break its old record set last year:

Camas Resale Home Sales 2014 - Average Sales Price Trends Camas Resale Home Sales - Average Sales Price Trend August 2018

Prices for closed sales this month are at the season-high level we expect for this month, supported by reasonably strong volume.

The remaining charts come from the RMLS Statistics package showing the important elements from the most recent twelve months in a mixed-graph-type format:

Charts of Camas WA Resale Home Sales Trends in August 2018 Camas Resale Home Sales Inventory & Days on Market - August 2018
The Inventory-by-Month graph shows both New Listings took a decent jump upwards while Pending Sales remained level. Closed Sales remained at a reasonably high late-summer level.

The second graph shows a rather large difference in average price between Closed Sales (lower) compared to New Listings (higher).  Thus, we expect potential softness in sales prices for the upcoming months.

The last graph shows the Average Days on Market moving upwards by a couple of weeks, while the Median Days on market only moved up a few days.

Thank you for viewing our report on home sales in Camas WA.  Please let us know how we can help you or help someone you know!

PS - we love to help our customers sell their Camas Home. If you are thinking of Selling or, just want to know what your home is worth? We offer a no-cost, no-obligation Online Camas WA Real Estate Home Price Valuation, and invite you to try it out Today!

PPS
- We also Love to help Camas Home Shoppers, and invite you to visit our page for Homes for sale in Camas WA , where 16 neighborhood searches are set up, such as: Homes for sale in Lacamas Shores, Homes for sale in Parker Estates, Homes for sale in Holly Hills, Camas WA; in addition to 7 category searches such as Condos for sale in Camas WA; Foreclosure Homes Camas WA,   Property listings are from the entire RMLS.

The Camas Real Estate charts in this report (prepared by Camas WA Real Estate Broker John Slocum, our resident statistician) are based on home sales recorded in the Camas  MLS system (RMLS), excluding sales of mobile home; and shows the purchase activity since 2009; charting the 3 month Moving average number of sales, and the 12 month Moving average.  This "smoothing" of the trend-data helps illustrate the short-term and longer term trends in the Camas real estate market.

Disclaimer: as with any real estate statistics, we always do our best to provide the best representation at the time the data was acquired.  We deem the data and reports reliable but not guaranteed.

Monday, October 8, 2018

Battle Ground WA Home Sales Report - August 2018

Strong Results for Battle Ground Home Sales in August 2018

Unlike Clark County as a whole, Battle Ground turned in strong Unit-Sales and Price results this period. Here are this month's highlights:
  • The 3-Month Moving Average for Price is $432,956 or +8.05% compared to the previous year; with the 12-Month Moving Average now at $406,525 or, +12.33% higher.
     
  • The Inventory level for Resale Homes stopped rising and retreated slightly, and is now at 2.4 Months.
     
  • Approximately 64 Pre-owned Homes closed in August, compared to 62 Sold in August 2017; an increase of 2 homes or, +3.2%.
     
  • REO/Bank Owned property sales were 1 units (1.6% of total); compared to 0 (0%) in August 2017. 
     
  • Short Sale /Pre-Foreclosure property sales were 2 units (3.1% of total); compared to 0 (0%) in August 2017.
Battle Ground's average sales price came in at $43,956 this month; giving up some of its lead over Vancouver's, and is now approximately $70,556 higher.

The next chart shows the short term (3-month moving average in red) and long term (12-months - blue) trend-lines for Unit-Home Sales shown below:

Battle Ground Resale Home Sales August 2018 - Units Sold Battle Ground Resale Home Sales -
Units Sold Trend August 2018

The short term trend has caught up to and even exceeded the previous summer-time peak; although overall at this point in the year we are behind last year by 10 properties (or, -2.65%) which is much less of a gap than seen for the rest of the County.

Battle Ground Resale Home Sales 2014 - Average Sales Price Trends Battle Ground Resale Home Sales -
Avg Sales Price Trend August 2018

Home sales prices fell slightly again this month, although they are still very near record high territory for this town.

The remaining charts in our report come from RMLS for Battle Ground WA and show:

Charts of Battle Ground WA Resale Home Sales Trends in August 2018 Battle Ground Resale Home Sales Inventory
& Days on Market August 2018
New Listings stayed about the same, while Pending Sales dropped substantially; while Closed Sales posted their strongest showing of the year.

Average New Listing Prices decreased modestly, while Closed Sales prices moved slightly lower.  

Finally, the Average Days on Market have remained the same; and Median Days on Market dropping slightly.  The pace of sales still shows this town in a Seller's Market. 

Thank you for reviewing our Home Sales report for Battle Ground Washington. Please contact us with any questions you have!

PS - We Love to List and Sell homes in Battle Ground! If you are thinking of selling this year we'd Love to Help You! The first step is to give us a Call (e-mail or Text is fine as well) and have us prepare a Current Home Price Market Valuation at no-cost, no-obligation to learn your home's current value and how the listing and sales process works.

PPS
- We also love to help Home Buyers looking at Battle Ground homes to purchase.  Our website is free to use, and provides several category searches, with property listings from the entire RMLS.  Battle Ground WA homes still represent a great value in 2018.  When you are ready to take the next step in purchasing a home or property, Give us a Call!

NOTE: Some of the popular Search Pages on our site include: Battle Ground Acreage Real Estate; Battle Ground Luxury Real Estate; Battle Ground One-Level Homes .

The Battle Ground Washington Real Estate informational charts used in this report (prepared by Realtor® John Slocum, our resident statistician) are based on home sales recorded in the Battle Ground  MLS system (RMLS), excluding sales of mobile home; and shows the purchase activity since 2009; charting the 3 month Moving average number of sales, and the 12 month Moving average.  This "smoothing" of the trend-data helps illustrate the short-term and longer term trends in the Battle Ground WA real estate market.

Disclaimer: as with any real estate statistics, we do our best to provide the best representation at the time the data was acquired.  We deem the data and reports reliable but not guaranteed.

Friday, October 5, 2018

Clark County WA Home Sales Report - August 2018

Disappointing Results for Home Sales in Clark County WA for August 2018.

Unit-volume sales are down 78 units when compared to the same month last year, with average sales prices starting to show softness. Here are the key highlights for this month: 
  • Average-Sales Prices are still in positive territory with the 12-month/long-term trend line up 10.36% compared to last year at this time;  and the 3-Month Moving Average is up 8.87% from August last year; 
     
  • The Inventory for Resale Homes notched up to 2.4 Months Supply;
     
  • Approximately 662 Resale Homes closed in the month, which is about 78 fewer (-10.54%) homes than in 2017; and 23 fewer than last month.
     
  • REO/Bank Owned property sales were 6 units (0.9% of total); down from 13 (1.8%) in 2017. 
     
  • Short Sale /Pre-Foreclosure property sales were 6 units (0.9% of total); up from 4 (0.5%) in 2017.
The month-end, 30-year-fixed home loan benchmark interest rate is 4.55% (up from 4.53% last month) according to Freddie Mac; compared to 3.88% for August 2017.

In the Unit-Volume chart below, the short term (in red) and long term (12-month moving average in Blue) trends are illustrated: 
Clark County Home Sales August 2018- Units Sold Clark County Home Sales - Units Sold Trend August 2018
This year the short-term trend is falling far short of the levels achieved in the prior three years; with the long-term trend clearly moving lower. This lower level of sales is consistent with the modest increase in available inventory.

The next chart for Average Sales Prices also describes the short-term and long-term trends for this measurement: 


Clark County Home Sales August 2018- Average Sales Price Trends Clark County Home Sales - Average Sales Price Trend August 2018

The August short term Average sales price for Clark County is now up to $400,376; but down slightly from last month . This is also an increase of about $32,617 from August last year.

Our remaining set of graphs (below) from RMLS show:
Charts of Vancouver WA Home Sales Trends in August 2018 Clark County Home Sales Inventory
& Days on Market - August 2018

Both New Listings and Pending Sales rose slightly, with Closed Sales coming in lower - actually quite a bit lower for this particular month. Active Inventory has been building with the slowdown in sales. 

The second graph shows Prices for both new listings and closed sales coming in lower than last month. 

Finally, for the Days on the Market, both the Average and the Median increased by almost a week - again, very uncharacteristic for one of the usually best sales months of the entire year.

If you are interest the RMLS published report on the Clark County real estate scene can be found here: RMLS Market Action Report on our main website.


PS - The real estate market is clearly changing, but there is still time to List and Sell Your Home with Our Team for 2018; or, at least find out what your home is worth!  We offer a no-cost, no-obligation Clark County WA Home Valuation, and invite you to try it out!

PPS - Looking to buy a home this year?  Interest rates are still at historically very low rates.  You are invited to visit our web-page for Clark County WA  Homes For Sale where it is Quite Easy to search by City, Neighborhood or by Category, with homes and real estate listings from the entire RMLS.  Sign-up Not Required!  The property and home listings shown are provided via many updates each day, and you will be e-mailed hourly with any new matches once you've signed up for a home search.

We also have the MLS Listings for these great towns in Clark County:  Battle Ground WA Real Estate | Brush Prairie WA Homes | Camas WA Homes For Sale | Hockinson WA Homes | La Center WA Homes for sale | Ridgefield WA Homes for sale | Homes for sale in Vancouver Washington | Washougal WA Real Estate | Yacolt WA Homes | Amboy WA Homes


The information and charts in this Clark County WA real estate update (prepared by Vancouver WA Real Estate Broker, John Slocum, CRS, SFR, our resident statistician) are based on home sales recorded in the Clark County WA MLS system (RMLS), excluding sales of mobile home; and shows the purchase activity since 2009; charting the 3 month Moving average number of sales, and the 12 month Moving average.  This "smoothing" of the trend-data helps illustrate the short-term and longer term trends in Clark County's real estate market.

Disclaimer: as with any real estate statistics, we do our best to provide the best representation at the time the data was acquired and compiled.  The data and reports are deemed reliable but not guaranteed.