Showing posts with label realtor clark county wa. Show all posts

Friday, February 18, 2022

Clark County WA Real Estate For Sale - January 2022 Report

Real Estate Closed Sale Prices rise slightly; with Unit Sales Slowing being Constrained by Lack of Inventory for Clark County WA in January 2022.

Sales Prices rose modestly to achieve another new High. Seasonally we expect the number of Units-Sold per-month to be falling - although this year's number is much less than last year's - very likely due to the greatly reduced available Inventory for home buyers to shop. Here are the highlights for this month:  

  • Average-Sales Price moved up just over $4k+ finishing up at $555,946; with the 12-month/long-term trend line up 18.48% year-over-year;  and the 3-Month Moving Average up 18.05% from this time last year; 
     
  • The Inventory for Resale Property moved up only 0.1 Month's worth, ending at the super-low 0.3 Month's worth of Supply;
     
  • Approximately 390 Resale Properties were sold/closed, which is about 42 less (9.72%) properties than in 2021; and 276 fewer than last month;
     
  • REO/Bank Owned property sales were 0 units (0% of total); down from 2 (0.46%) in 2021; 
     
  • Short Sale /Pre-Foreclosure property sales were 0 units (0% of total); no change from 0 (0%) last year.

The Freddie Mac's report on the 30-year-fixed mortgage loan interest rate (nationwide average) at month-end, rose strongly ending at a monthly average of 3.45% ; compared to 2.74% for January 2021. Rates have risen strongly this first month of the year, and are expected to have continued upward pressure in the near term.

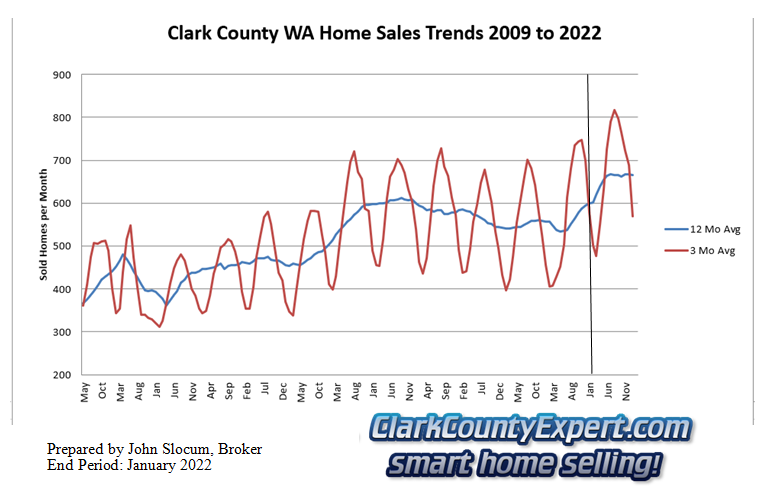
Next up is a Custom Chart (below) I created to show Property-Sales Unit-Volume (number of properties sold) with short term (in Red) and long term (12-month moving average in Blue) trends: 
Clark County Home Sales January 2022- Units Sold Clark County Real Estate - Units Sold Trend January 2022

The short-term trend is both in the stronger-part of its seasonal decline, compounded by the much lower level of closings seen from the dearth of Inventory. The long-term trend-line is stubbornly in a plateau however, this cannot last much longer at a continued slower pace of sales. This month's sales for the County is behind last year's total home sales by 42 properties (-9.72%).

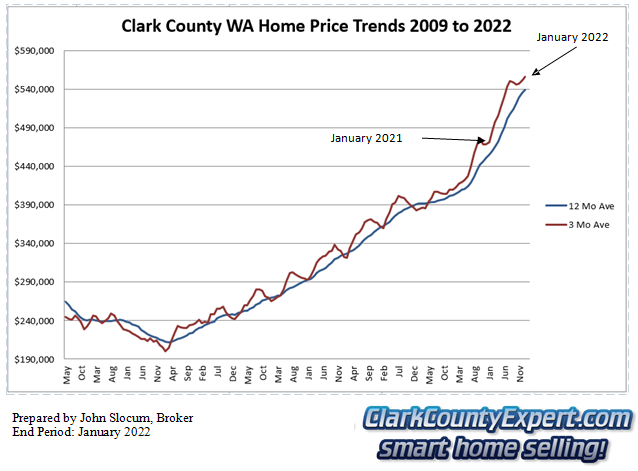
Continuing on is my chart showing the Average Real Estate Sales Price, the short-term line climbing slightly to a new high; with the long-term trend also moving up to a new high: 
Clark County Home Sales January 2022- Average Sales Price Trends Clark County Real Estate Sales - Average Sales Price Trend January 2022

Clearly Prices over the past 12 months have risen strongly overall at a pace not far under 20%. With Interest rates jumping up recently, we expect prices to be facing stronger headwinds in the near-term.
 
Clark County's Average Residential Property Sales Price (using the most recent 3 months) is now $555,946; which is approximately $85,025 (+18.05%) higher than this time last year.

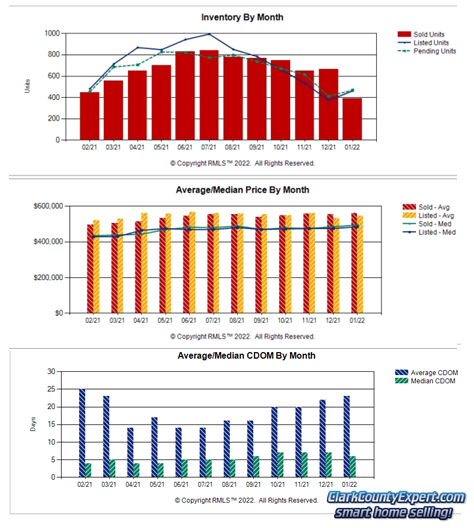
The remaining collection of graphs for this real estate sales report come from RMLS and show:
Charts of Vancouver WA Home Sales Trends in January 2022 Clark County Real Estate Sales Inventory
& Days on Market - January 2022


New Listings and  Pending Sales both rose at about the same pace this month; with Closed Sales quite a bit lower than the previous month. With New Listings not moving up strongly so far,  Active Inventory only moved slightly up to 0.3 month's of supply. 

The second graph shows the Average Price for Closed Sales hitting a new high; and the Average Listing Price coming in modestly below that number.

Finally, the Average Days on Market increased by 1 day finishing at 23 days; and Median Days on Market fell one day ending at 6 days. The pace of this market is still quick for this typically slower time of year.  

Thank you for visiting our Real Estate Market Report for Clark County WA. Please let me know if you have any questions or need help with your home or condo sale or purchase in 2022!


PS - The real estate market is changing, prices are still rising, with loan costs now Rising, this may be an excellent time to List and Sell Your Property with Our Team; or, at least find out what your property is worth!  We offer a no-cost, no-obligation Clark County WA Property Valuation, and invite you to try it out!

PPS - Looking to buy a property reasonably soon?  Interest rates are still at historically low rates.  You are invited to visit our web-page for Clark County WA Real Estate For Sale where it is Quite Easy to search by City, Neighborhood or by Category, with homes and real estate listings from the entire RMLS.  Sign-up Not Required!  The property and home listings shown are provided via many updates each day, and you will be e-mailed hourly with any new matches once you've signed up for a home search.

We also have the MLS Listings for these great towns in Clark County:  Battle Ground WA Real Estate For Sale | Brush Prairie WA Homes For Sale | Camas WA Homes for Sale | Hockinson WA Homes For Sale | La Center WA Homes for sale | Ridgefield WA Homes for sale | Real Estate for sale in Vancouver Washington | Washougal WA Real Estate | Yacolt WA Homes For Sale | Amboy WA Homes For Sale


The information and charts in this Clark County WA real estate update (prepared by Clark County WA Real Estate Sales Realtor, John Slocum, SFR, our resident statistician) are based on home sales recorded in the Clark County WA MLS system (RMLS), excluding sales of mobile home; and shows the purchase activity since 2009; charting the 3 month Moving average number of sales, and the 12 month Moving average.  This "smoothing" of the trend-data helps illustrate the short-term and longer term trends in Clark County's real estate market.

Disclaimer: as with any real estate statistics, we do our best to provide the best representation at the time the data was acquired and compiled.  The data and reports are deemed reliable but not guaranteed.

Tuesday, January 12, 2021

Real Estate for sale Clark County WA - December 2020

Unseasonably-Strong Real Estate Property-Sales While Sales Prices End the Year-2020 at Near Record for Clark County WA in December 2020.

The Pace of Property sales was one of the fastest this past 12 months; while the extremely low level of active Inventory contracted again! Here are the highlights for this month:  

  • Average-Sales Price eased by about $8k finishing up at $468,757; with the 12-month/long-term trend line up 12.27% year-over-year;  and the 3-Month Moving Average up 14.34% from this time last year; 
     
  • The Inventory for Resale Property fell again and finished at 0.5 Month's worth of Supply;
     
  • Approximately 600 Resale Properties were sold/closed, which is about 145 more (31.9%) properties than in 2019; although 66 fewer than last month;
     
  • REO/Bank Owned property sales were 4 units (0.67% of total); up from 2 (0.44%) in 2019; 
     
  • Short Sale /Pre-Foreclosure property sales were 1 units (0.17% of total); down from 2 (0.44%) last year.

The Freddie Mac's report on the 30-year-fixed mortgage loan interest rate (nationwide average) at month-end, fell again to a monthly average of 2.68% (another All-Time Low!); compared to 3.72% for December 2019. The Annual 2020 Average came in at 3.11% - compared to 2019's number of 3.94%!

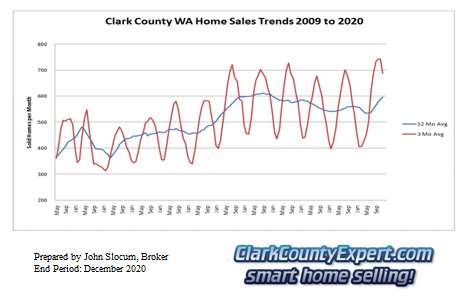
For the Property-Sales Unit-Volume (number of properties sold) with short term (in Red) and long term (12-month moving average in Blue) trends I've prepared this chart: 

Clark County Home Sales December 2020- Units Sold Clark County Real Estate - Units Sold Trend December 2020

With continued strong late-season property sales the short-term line is at a much higher level, though declining, than we typically see at the end of the year. Long-term the trend-line continues moving up nearing its all-time high. Finishing the year the County is now ahead of last years total home sales by 271 homes (or, 4.03%).

This month the Average Real Estate Sales Price tread-water (less than $300 difference from last month) in the near-term; while long-term the trend is still very positive: 

Clark County Home Sales December 2020- Average Sales Price Trends Clark County Real Estate Sales - Average Sales Price Trend December 2020

This year real estate prices have risen farther than they have at any time since the market "bottom" at January 2012." In fact, even with the super-low financing rates the Impact to Affordability will be very hard to ignore in the present and coming months to come.
 
Clark County's Average Home Sales Price (using the most recent 3 months) is now $468,757; which is approximately $58,799 (+14.34%) higher than this time last year.

My final charts for our real estate sales report come from RMLS and show:

Charts of Vancouver WA Home Sales Trends in December 2020 Clark County Real Estate Sales Inventory
& Days on Market - December 2020


New Listings dropped to post its lowest mark for the past 12 months. Pending Sales also came in lower to its second-lowest mark for the year. Closed Sales eased but stayed at a relatively high level. Active Inventory at 0.5 month's of supply is extremely low, making it tough on home shoppers that once had an easier time at the end of the year. 

The second graph shows the Average Price for Closed Sales at its second-highest level for the year; and Average Listing Price came in lower than the closed-sales price.

Finally, the market pace was about the fastest for the year; with the Average Days on Market falling by 6 days; while the Median Days on the Market fell one day. This rapid-paced market is unprecedented in my experience.

Thank you for visiting our Real Estate Sales Report for Clark County Washington. Please let me know if you have any questions or need help with your home or condo sale or purchase!


PS - The real estate market is changing, prices are still rising, with loan costs presently at RECORD low levels, keeping this an excellent time to List and Sell Your Property with Our Team; or, at least find out what your property is worth!  We offer a no-cost, no-obligation Clark County WA Property Valuation, and invite you to try it out!

PPS - Looking to buy a property reasonably soon?  Interest rates are still at historically low rates.  You are invited to visit our web-page for Clark County WA Real Estate For Sale where it is Quite Easy to search by City, Neighborhood or by Category, with homes and real estate listings from the entire RMLS.  Sign-up Not Required!  The property and home listings shown are provided via many updates each day, and you will be e-mailed hourly with any new matches once you've signed up for a home search.

We also have the MLS Listings for these great towns in Clark County:  Battle Ground WA Real Estate For Sale | Brush Prairie WA Homes For Sale | Camas WA Homes for Sale | Hockinson WA Homes For Sale | La Center WA Homes for sale | Ridgefield WA Homes for sale | Real Estate for sale in Vancouver Washington | Washougal WA Real Estate | Yacolt WA Homes For Sale | Amboy WA Homes For Sale


The information and charts in this Clark County WA real estate update (prepared by Vancouver WA Real Estate Sales Realtor, John Slocum, SFR, our resident statistician) are based on home sales recorded in the Clark County WA MLS system (RMLS), excluding sales of mobile home; and shows the purchase activity since 2009; charting the 3 month Moving average number of sales, and the 12 month Moving average.  This "smoothing" of the trend-data helps illustrate the short-term and longer term trends in Clark County's real estate market.

Disclaimer: as with any real estate statistics, we do our best to provide the best representation at the time the data was acquired and compiled.  The data and reports are deemed reliable but not guaranteed.
Friday, May 8, 2020

Home Sales Report Vancouver WA - April 2020

Unit-Home Sales and New Listings Plummet with Continued Price Rise for Clark County WA in April 2020.

With a full month of the effects of the government response to the pandemic, we are seeing a big drop in both Closed Sales and in New Listings, yet - prices have not yet fallen. Here are the key elements for this month's report: 
  • Average-Sales Price moved up to $420,486 - another all-time high, with the 12-month/long-term trend line up 4.43% year-over-year;  and the 3-Month Moving Average up 9.15% from this time last year; 
     
  • The Inventory for Resale Real Estate remained unchanged at a very low 1.2 Month level of Supply;
     
  • Approximately 407 Resale Properties were sold/closed, which is about 130 fewer (-24.21%) homes than in 2019; and 47 fewer than last month;
     
  • REO/Bank Owned property sales were 5 units (1.23% of total); down from 10 (1.86%) in 2019; 
     
  • Short Sale /Pre-Foreclosure property sales were 2 unit (0.49% of total); down from 5 (0.9%) in 2019.
The Home Mortgage 30-year-fixed loan interest rate (nationwide average) at month-end, fell moderately to 3.31% (Down from 3.45% last month) according to Freddie Mac; compared to 4.47% for April 2019. Now in uncharted territory with the federal and world-wide response to the current pandemic, we expect rates to remain lower and perhaps enter the 2% range.

Below we have our custom chart for Unit-Volume (number of properties sold) showing short term (in Red) and long term (12-month moving average in Blue) trends: 
Clark County Home Sales April 2019- Units Sold Clark County Home Sales - Units Sold Trend April 2020
Unit-sales have turned the corner however, the pace going upward is very weak this year - which is to be expected with the massive disruption to the local and wider economy.   

Our graph for the action in the Average Home Sales Price is shown next, showing the current and past Home-Sales-Price results for both short-term and long-term: 


Clark County Home Sales April 2019- Average Sales Price Trends Clark County Home Sales - Average Sales Price Trend April 2020
The continued low level of Active Inventory is keeping the upward pressure on Prices; although it is difficult to think rising prices can continue much longer. 

The Average Sales Price (using 3 months) for Clark County is now $420,486; which is approximately $35,242 higher than this time last year.

The final charts come from RMLS and show:
Charts of Vancouver WA Home Sales Trends in April 2019 Clark County Home Sales Inventory
& Days on Market - April 2020

New Listings fell off the cliff this month when we would expect to see them rocketing up; while Pending Sales tread-water; and Closed Sales retreated slightly. At this point the level of Inventory did not change, and is still at a very low level. 

The second graph shows both the Closed Sales and Average Sales pricing turning in very strong marks, which in turn is reflected in the charts showing rising prices.

Lastly, both Average Days on Market and Median Days on the Market posted lower numbers like we regularly see this time of year.

Thank you for visiting our Real Estate Market report for Clark County WA. Please let us know if you have any questions or need help with your home or condo!


PS - The real estate market is changing, prices are expected to soften, with loan costs presently at very low levels, keeping this an excellent time to List and Sell Your Property with Our Team; or, at least find out what your property is worth!  We offer a no-cost, no-obligation Clark County WA Real Estate Valuation, and invite you to try it out!

PPS - Looking to buy a property reasonably soon?  Interest rates are still at historically low rates.  You are invited to visit our web-page for Clark County WA Real Estate For Sale where it is Quite Easy to search by City, Neighborhood or by Category, with homes and real estate listings from the entire RMLS.  Sign-up Not Required!  The property and home listings shown are provided via many updates each day, and you will be e-mailed hourly with any new matches once you've signed up for a home search.

We also have the MLS Listings for these great towns in Clark County:  Battle Ground WA Real Estate For Sale | Brush Prairie WA Homes For Sale | Camas WA Homes for Sale | Hockinson WA Homes For Sale | La Center WA Homes for sale | Ridgefield WA Homes for sale | Real Estate for sale in Vancouver Washington | Washougal WA Real Estate | Yacolt WA Homes For Sale | Amboy WA Homes For Sale


The information and charts in this Clark County WA real estate update (prepared by Vancouver WA Real Estate Sales Broker, John Slocum, CRS, SFR, our resident statistician) are based on home sales recorded in the Clark County WA MLS system (RMLS), excluding sales of mobile home; and shows the purchase activity since 2009; charting the 3 month Moving average number of sales, and the 12 month Moving average.  This "smoothing" of the trend-data helps illustrate the short-term and longer term trends in Clark County's real estate market.

Disclaimer: as with any real estate statistics, we do our best to provide the best representation at the time the data was acquired and compiled.  The data and reports are deemed reliable but not guaranteed.

Sunday, March 22, 2020

Home Sales Report Clark County WA - February 2020

Unit-Home Sales Edging Lower while Price Level Rose for Clark County WA in February 2020.

Starting the new the year we have fewer Active Listings with Less than One (1) Month of Available Inventory; which has resulted in slightly lower unit sales this month; with Prices remaining near their all-time high.  Here are the key elements for this month's report: 
  • Average-Sales Price returned to an uptick to $413,295 which is now the new all-time high, with the 12-month/long-term trend line up 3.11% year-over-year;  with the 3-Month Moving Average up 7.52% from this time last year; 
     
  • The Inventory for Resale Real Estate saw no change at the very low 0.8 Months level of Supply;
     
  • Approximately 375 Resale Properties closed in the month, which is about 13 fewer (-3.35%) homes than in 2019; and 9 more than last month;
     
  • REO/Bank Owned property sales were 4 units (1.1% of total); up from 2 (0.5%) in 2019; 
     
  • Short Sale /Pre-Foreclosure property sales were 2 unit (0.53% of total); no change from 2 (0.52%) in 2019.
The Home Mortgage month-end, 30-year-fixed loan interest rate (nationwide average) resumed its fall to 3.47% (Down from 3.62% last month) according to Freddie Mac; compared to 4.37% for February 2019. The current rate level is now seeing support, as a large number of Refinance applications are being processed.

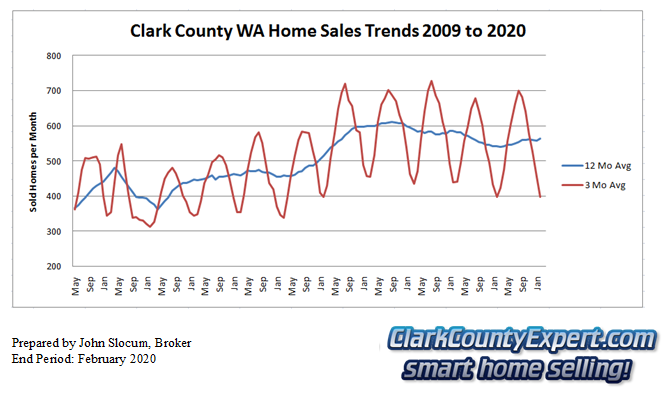
The following custom chart for Unit-Volume (number of properties sold) shows short term (in Red) and long term (12-month moving average in Blue) trends: 
Clark County Home Sales February 2019- Units Sold Clark County Home Sales - Units Sold Trend February 2020
The Short Term trend is nearing its bottom-out point for the year, and appears to be going slightly lower than the low-point for last year. The long-term trend is still generally horizontal.   

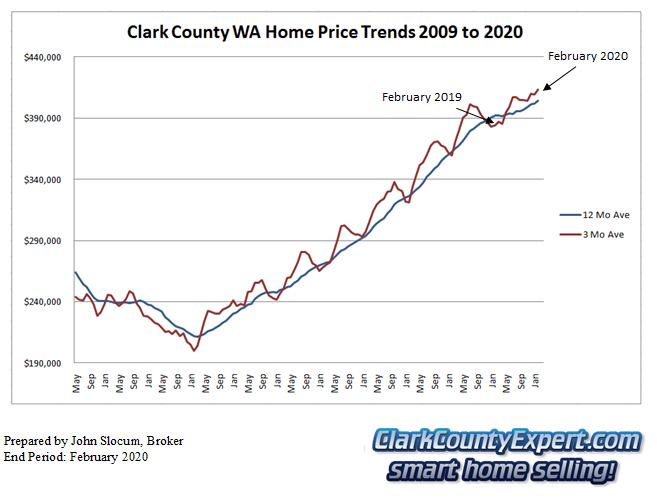
The Trends for the Average Home Sales Price are shown in the next chart, displaying the current and historical Home-Sales-Price results in both short-term and long-term: 


Clark County Home Sales February 2019- Average Sales Price Trends Clark County Home Sales - Average Sales Price Trend February 2020
The extremely low a level of Active Inventory has kept Prices at their highest-ever level. With the nation's current response to the current pandemic we expect prices to soften, and perhaps substantially.

The Average Sales Price (using 3 months) for Clark County is now $413,295; which is an increase of approximately $26,302 from this time last year.

The final collection of graphs for this report come from RMLS and show:
Charts of Vancouver WA Home Sales Trends in February 2019 Clark County Home Sales Inventory
& Days on Market - February 2020

Both New Listings and Pending Sales have made a lock-step although modest upswing; with Closed Sales moving up slightly from last month. 

The second graph shows both the Closed Sales and Average Sales pricing coming in strong.

Finally, Average Days on Market fell quite a bit; and Median Days on the Market fell even more percentage-wise.
I have also posted the recent RMLS published report on the Clark County home sales

Thank you for visiting our Home Sales report for Clark County WA. Please let us know if you have any questions or need help with your home or condo!


PS - The Home sales market is changing, prices are softer with loan costs presently at very low levels, keeping this an excellent time to List and Sell Your Property with Our Team; or, at least find out what your property is worth!  We offer a no-cost, no-obligation Clark County WA Home Price Valuation, and invite you to try it out!

PPS - Looking to buy a property reasonably soon?  Interest rates are still at historically low rates.  You are invited to visit our web-page for Clark County WA Homes For Sale where it is Quite Easy to search by City, Neighborhood or by Category, with homes and real estate listings from the entire RMLS.  Sign-up Not Required!  The property and home listings shown are provided via many updates each day, and you will be e-mailed hourly with any new matches once you've signed up for a home search.

We also have the MLS Listings for these great towns in Clark County:  Battle Ground WA Real Estate For Sale | Brush Prairie WA Homes For Sale | Camas WA Homes for Sale | Hockinson WA Homes For Sale | La Center WA Homes for sale | Ridgefield WA Homes for sale | Real Estate for sale in Vancouver Washington | Washougal WA Real Estate | Yacolt WA Homes For Sale | Amboy WA Homes For Sale


The information and charts in this Clark County WA real estate update (prepared by Vancouver WA Real Estate Sales Broker, John Slocum, CRS, SFR, our resident statistician) are based on home sales recorded in the Clark County WA MLS system (RMLS), excluding sales of mobile home; and shows the purchase activity since 2009; charting the 3 month Moving average number of sales, and the 12 month Moving average.  This "smoothing" of the trend-data helps illustrate the short-term and longer term trends in Clark County's real estate market.

Disclaimer: as with any real estate statistics, we do our best to provide the best representation at the time the data was acquired and compiled.  The data and reports are deemed reliable but not guaranteed.

Tuesday, November 12, 2019

Clark County WA Home Sales Report - October 2019

Another Good Month of Home Sales Results for Clark County WA in October 2019.

With a moderation of price-increases, along with very low home loan rates at this time, unit-sales for homes in the county have performed very well. Inventory fell again with new listings matching pending listings. Here are the highlights for this month's report: 

  • Average-Sales Price slipped less than $1k to  $405,574, with the 12-month/long-term trend line up 3.2% year-over-year;  with the 3-Month Moving Average up 3.1% from this time last year (up slightly from last month); 
     
  • The Inventory for Resale Real Estate slipped 0.2 months to an even lower 1.7 Months of Supply;
     
  • Approximately 552 Resale Properties closed in the month, which is about 11 fewer (-1.95%) homes than in 2018; and 38 fewer than last month;
     
  • REO/Bank Owned property sales were 1 unit (0.18% of total); down from 5 (0.89%) in 2018; 
     
  • Short Sale /Pre-Foreclosure property sales were 1 unit (0.18% of total); no change from 1 (0.18%) in 2018.

Home Mortgage month-end, 30-year-fixed loan interest rate (nationwide average) rose slightly to 3.69% (Up from 3.61% last month) according to Freddie Mac; compared to 4.83% for October 2018. The current rate level is expected to move slightly up and down for the near term.

Next we have my custom chart for Unit-Volume (number of properties sold) that shows the short term (in Red) and long term (12-month moving average in Blue) trends: 

Clark County Home Sales October 2019- Units Sold Clark County Home Sales - Units Sold Trend October 2019

The improved mid-to-late season sales have continued to nudge the long-term trend slightly upward, with the short-term line now in its seasonal downturn which started at a reasonably high level.  

Next we have the Average Home Sales Price trend-chart, highlighting the current and historical Home-Sales-Price results in both short-term and long-term: 

Clark County Home Sales October 2019- Average Sales Price Trends Clark County Home Sales - Average Sales Price Trend October 2019

We are now in the zone where home sales prices are typically "softer" with the expectation that the direction of the short-term line will be slightly downward. These past two years we are seeing a decrease in the Long-Term line's price rise trend. With Inventory at such a low level, combined with low financing rates, we don't expect this measure to go much flatter.
 
The Average Sales Price (using 3 months) for Clark County is now $405,574; which is an increase of approximately $12,203 from this time last year.

The final charts for this report come from RMLS and show:

Charts of Vancouver WA Home Sales Trends in October 2019 Clark County Home Sales Inventory
& Days on Market - October 2019


New Listings, Pending Sales and Closed Sales all moved ever so slightly downward, and they all ended up close to each other. 

The second graph shows both Average List prices falling back lower, while Sales Prices were higher than last month.

Finally, Average Days on Market and Median Days on the Market both moved upwards by several days.

You may also find posted the recent RMLS published report on the Clark County home sales market here: RMLS Market Action Report on our main website.

Thank you for reviewing our Home Sales report for Clark County WA. Please let us know if you have any questions or need help with your home or condo!


PS - The home sales market is changing, prices are softer with loan costs presently at very low levels, keeping this an excellent time to List and Sell Your Home with Our Team; or, at least find out what your property is worth!  We offer a no-cost, no-obligation Clark County WA Home Valuation, and invite you to try it out!

PPS - Looking to buy a house reasonably soon?  Interest rates are still at historically low rates.  You are invited to visit our web-page for Clark County WA Homes For Sale where it is Quite Easy to search by City, Neighborhood or by Category, with homes and real estate listings from the entire RMLS.  Sign-up Not Required!  The property and home listings shown are provided via many updates each day, and you will be e-mailed hourly with any new matches once you've signed up for a home search.

We also have the MLS Listings for these great towns in Clark County:  Battle Ground WA Real Estate For Sale | Brush Prairie WA Homes For Sale | Camas WA Homes for Sale | Hockinson WA Homes For Sale | La Center WA Homes for sale | Ridgefield WA Homes for sale | Real Estate for sale in Vancouver Washington | Washougal WA Real Estate | Yacolt WA Homes For Sale | Amboy WA Homes For Sale


The information and charts in this Clark County WA real estate update (prepared by Vancouver WA Home Sales Broker, John Slocum, CRS, SFR, our resident statistician) are based on home sales recorded in the Clark County WA MLS system (RMLS), excluding sales of mobile home; and shows the purchase activity since 2009; charting the 3 month Moving average number of sales, and the 12 month Moving average.  This "smoothing" of the trend-data helps illustrate the short-term and longer term trends in Clark County's real estate market.

Disclaimer: as with any real estate statistics, we do our best to provide the best representation at the time the data was acquired and compiled.  The data and reports are deemed reliable but not guaranteed.

Wednesday, June 12, 2019

Clark County WA Real Estate Sales - May 2019 Update

Real Estate Sales Move Up for Clark County WA in May 2019.

Closed Unit-Sales came in at 19 units below last year for the same month - and Down 103 units (-4.18%) year-to-date; while the short-term price-trend edged up modestly. Here are this month's highlights: 
  • Average-Sales Price trend is showing a slowing of increase, with the 12-month/long-term trend line up 5.94% year-over-year;  with the 3-Month Moving Average up 1.52% from this time last year; 
     
  • The Inventory for Resale Real Estate rose 0.2 months, and is now at 2.0 Months of Supply;
     
  • Approximately 589 Resale Properties closed in the month, which is about 19 fewer (-3.1%) homes than in 2018; and 61 more than last month;
     
  • REO/Bank Owned property sales were 3 units (0.5% of total); down from 10 (1.6%) in 2018; 
     
  • Short Sale /Pre-Foreclosure property sales were 2 units (0.34% of total); down from 9 (1.48%) in 2018.
For Real Estate Financing interest rates the month-end, 30-year-fixed loan interest rate (nationwide average) is 4.07% (Down from 4.14% last month) according to Freddie Mac; compared to 4.59% for May 2018. The current rate level is the lowest we've seen in the past 15 months!

Next up are custom Unit-Volume (number of properties sold) chart showing the short term (in Red) and long term (12-month moving average in Blue) trends (shown below): 
Clark County Home Sales May 2019- Units Sold Clark County Real Estate Sales - Units Sold Trend May 2019
This month the Short-term trend line nearly-pierces the Long Term from below; and the Long-term line is showing signs of perhaps stabilizing at this level of activity. 

The Average Home Sales Price trends chart is up next, showing the action in both the short-term and long-term: 


Clark County Home Sales May 2019- Average Sales Price Trends Clark County Real Estate Sales - Average Sales Price Trend May 2019
The year-to-date action for prices is somewhat unique this year in that the short-term line has remained, until this month, below the flattening long-term trend line. We'll want to watch this action closely in the coming months to see if the long-term upswing will resume or, if we've entered a period of change and perhaps consolidation.

The Average (using 3 months) sales price for Clark County is now $396,671; which is an increase of approximately $5,957 from this time last year.

The remaining charts come from RMLS and show:
Charts of Vancouver WA Home Sales Trends in May 2019 Clark County Real Estate Sales Inventory
& Days on Market - May 2019

This month we see New Listings taking a large jump upwards, with Pending Sales and Closed Sales also increasing at a more modest pace. The net result has been a 0.2 month's worth of increase in the Available Inventory of properties for sale. 

The second graph with the Average List and Sales Prices shows the average price for new listings continues to post at a very high level; with the closed sales coming in relatively high as well. 

Finally, Both Average Days and Median Days on the Market fell into a zone of brisker activity we usually see in the Spring season.

We've also made available the recent RMLS published report on the Clark County real estate scene, and you can find it here: RMLS Market Action Report on our main website.

Thank you for visiting our report; and please let us know if you have any questions or need help with your home or condo!


PS - The real estate market is in change-mode as prices are softer with loan costs now falling, keeping this an excellent time to List and Sell Your Property with Our Team; or, at least find out what your property is worth!  We offer a no-cost, no-obligation Clark County WA Real Estate Valuation, and invite you to try it out!

PPS - Looking to buy a house reasonably soon?  Interest rates have been falling and are still at historically low rates.  You are invited to visit our web-page for Clark County WA  Houses For Sale where it is Quite Easy to search by City, Neighborhood or by Category, with homes and real estate listings from the entire RMLS.  Sign-up Not Required!  The property and home listings shown are provided via many updates each day, and you will be e-mailed hourly with any new matches once you've signed up for a home search.

We also have the MLS Listings for these great towns in Clark County:  Battle Ground WA Real Estate For Sale | Brush Prairie WA Homes For Sale | Camas WA Homes for Sale | Hockinson WA Homes For Sale | La Center WA Homes for sale | Ridgefield WA Homes for sale | Real Estate for sale in Vancouver Washington | Washougal WA Real Estate | Yacolt WA Homes For Sale | Amboy WA Homes For Sale


The information and charts in this Clark County WA real estate update (prepared by Vancouver WA Real Estate Broker, John Slocum, CRS, SFR, our resident statistician) are based on home sales recorded in the Clark County WA MLS system (RMLS), excluding sales of mobile home; and shows the purchase activity since 2009; charting the 3 month Moving average number of sales, and the 12 month Moving average.  This "smoothing" of the trend-data helps illustrate the short-term and longer term trends in Clark County's real estate market.

Disclaimer: as with any real estate statistics, we do our best to provide the best representation at the time the data was acquired and compiled.  The data and reports are deemed reliable but not guaranteed.

Wednesday, May 15, 2019

Clark County WA Home Sales - April 2019 Report

Home Sales in the Seasonal Upswing, although at a Slower Pace for Clark County WA in April 2019.

Closed Unit-Sales fell only 14 units compared last year in the same month - and Down 92 units (-4.95%) year-to-date; while the short-term price-trend fell slightly from last month. Here are this month's key points: 
  • Average-Sales Price increases are slowing, with the 12-month/long-term trend line up 6.72% year-over-year;  with the 3-Month Moving Average up 1.9% from this time last year; 
     
  • The Inventory for Resale Homes rose 0.3 months, and is now at (the still low) 1.8 Months of Supply;
     
  • Approximately 520 Resale Homes closed in the month, which is about 14 fewer (-2.6%) homes than in 2018; and 29 more than last month;
     
  • REO/Bank Owned property sales were 9 units (1.7% of total); up from 8 (1.5%) in 2018; 
     
  • Short Sale /Pre-Foreclosure property sales were 5 units (0.96% of total); up from 0 (0%) in 2018.
For Financing costs we see the month-end, 30-year-fixed home loan interest rate (nationwide average) is 4.14% (Down from 4.27% last month) according to Freddie Mac; compared to 4.47% for April 2018. The current rate level is lowest it has been in the past 14 months!

Continuing on I have prepared a Unit-Volume (number of homes sold) chart showing the short term (in red) and long term (12-month moving average in Blue) trends (shown below): 
Clark County Home Sales April 2019- Units Sold Clark County Home Sales - Units Sold Trend April 2019
The Short-term trend line is rising nicely from the seasonal low; with the long-term trend appearing to be moving side-ways now, instead of going lower.

The next chart shows the Average Home Sales Price trends, both short-term and long-term: 


Clark County Home Sales April 2019- Average Sales Price Trends Clark County Home Sales - Average Sales Price Trend April 2019
Without a doubt, the start of this year's "high season" is showing a very soft profile to the price trend, which is very different when compared to the same time period in the past 5 years. This pattern makes great sense in light of a real estate market that is slowing locally and nationwide.

The short term Average sales price for Clark County is now $386,869; which is an increase of approximately $7,200 from the same month last year.

The final graphs are from RMLS and show:
Charts of Vancouver WA Home Sales Trends in April 2019 Clark County Home Sales Inventory
& Days on Market - April 2019

This month we see New Listings growing at a steeper slope than Pending Sales and Closed Sales are. This is one reason the Active Inventory level has risen modestly. 

The second graph with the Average List and Sales Prices shows the average price for new listings again moving to a very high level. 

Both Average Days and Median Days on the Market fell substantially, which is what we expect at this stage of the high-season.

For the recent RMLS published report on the Clark County real estate scene you can find it here: RMLS Market Action Report on our main website.

Thank you for visiting our report; and please let us know if you have any questions or need help with your home or condo!


PS - The home sales market is in change-mode as prices are softer with loan costs now falling, keeping this an excellent time to List and Sell Your Home with Our Team; or, at least find out what your home is worth!  We offer a no-cost, no-obligation Clark County WA Home Valuation, and invite you to try it out!

PPS - Looking to buy a home reasonably soon?  Interest rates have been falling and are still at historically low rates.  You are invited to visit our web-page for Clark County WA  Homes For Sale where it is Quite Easy to search by City, Neighborhood or by Category, with homes and real estate listings from the entire RMLS.  Sign-up Not Required!  The property and home listings shown are provided via many updates each day, and you will be e-mailed hourly with any new matches once you've signed up for a home search.

We also have the MLS Listings for these great towns in Clark County:  Battle Ground WA Homes For Sale | Brush Prairie WA Homes For Sale | Camas WA Homes for Sale | Hockinson WA Homes For Sale | La Center WA Homes for sale | Ridgefield WA Homes for sale | Homes for sale in Vancouver Washington | Washougal WA Real Estate | Yacolt WA Homes For Sale | Amboy WA Homes For Sale


The information and charts in this Clark County WA real estate update (prepared by Vancouver WA Real Estate Broker, John Slocum, CRS, SFR, our resident statistician) are based on home sales recorded in the Clark County WA MLS system (RMLS), excluding sales of mobile home; and shows the purchase activity since 2009; charting the 3 month Moving average number of sales, and the 12 month Moving average.  This "smoothing" of the trend-data helps illustrate the short-term and longer term trends in Clark County's real estate market.

Disclaimer: as with any real estate statistics, we do our best to provide the best representation at the time the data was acquired and compiled.  The data and reports are deemed reliable but not guaranteed.

Thursday, December 13, 2018

Home Sales Report Clark County WA - November 2018

Declining Sales of Existing Homes in Clark County WA for November 2018.

Existing (pre-owned) homes, like other parts of the nation, have been slowing significantly, and we are down 104 units this month compared to the same time last year. Here are highlights for this month: 

  • Average-Sales Prices are up but at a slower pace, with the 12-month/long-term trend line up 9.06% compared to last year at this time;  and the 3-Month Moving Average is up 5.94% from November last year; 
     
  • The Inventory for Resale Homes slipped to 1.8 Months Supply;
     
  • Approximately 479 Resale Homes closed in the month, which is about 104 fewer (-17.8%) homes than in 2017; and 80 fewer than last month.
     
  • REO/Bank Owned property sales were 2 units (0.4% of total); down from 9 (1.5%) in 2017. 
     
  • Short Sale /Pre-Foreclosure property sales were 0 units (0.0% of total); down from 2 (0.3%) in 2017.

The month-end, 30-year-fixed home loan benchmark interest rate is 4.87% (up slightly from 4.83% last month) according to Freddie Mac; compared to 3.92% for November 2017.

I've prepared a custom Unit-Volume chart to illustrate both the short term (in red) and long term (12-month moving average in Blue) trends (shown below): 

Clark County Home Sales November 2018- Units Sold Clark County Home Sales - Units Sold Trend November 2018

Even with both trend-lines declining, the short term trend has fallen below the long-term trend one month earlier this year.  Higher home-loan rates and higher home prices are a tough combination to have and not expect the number of sales to fall to some extent.

The next chart is for Average Home Sales Price trends, both the short-term and long-term: 

Clark County Home Sales November 2018- Average Sales Price Trends Clark County Home Sales - Average Sales Price Trend November 2018


The November short term Average sales price for Clark County is now at $389,547; which is down from the peak 4 months ago. This represents an increase of approximately $21,855 from the same month last year.

Our remaining set of charts from RMLS show:

Charts of Vancouver WA Home Sales Trends in November 2018 Clark County Home Sales Inventory
& Days on Market - November 2018


New Listings, Pending Sales and Closed Sales in lock-step going lower. Active Inventory fell slightly. 

The second graph with Prices shows new listings and closed sales coming in at lower levels than the peak. 

Days on the Market, Average and Median, fell slightly. Both are still well above the summer-time levels.

The latest RMLS published report on the Clark County real estate scene can be found here: RMLS Market Action Report on our main website.


PS - The real estate market is adjusting to the much higher prices combined with higher loan costs however, there is still time to List and Sell Your Home with Our Team; or, at least find out what your home is worth!  We offer a no-cost, no-obligation Clark County WA Home Valuation, and invite you to try it out!

PPS - Looking to buy a home reasonably soon?  Interest rates are still at historically very low rates.  You are invited to visit our web-page for Clark County WA  Homes For Sale where it is Quite Easy to search by City, Neighborhood or by Category, with homes and real estate listings from the entire RMLS.  Sign-up Not Required!  The property and home listings shown are provided via many updates each day, and you will be e-mailed hourly with any new matches once you've signed up for a home search.

We also have the MLS Listings for these great towns in Clark County:  Battle Ground WA Real Estate | Brush Prairie WA Homes | Camas WA Homes For Sale | Hockinson WA Homes | La Center WA Homes for sale | Ridgefield WA Homes for sale | Homes for sale in Vancouver Washington | Washougal WA Real Estate | Yacolt WA Homes | Amboy WA Homes


The information and charts in this Clark County WA real estate update (prepared by Vancouver WA Real Estate Broker, John Slocum, CRS, SFR, our resident statistician) are based on home sales recorded in the Clark County WA MLS system (RMLS), excluding sales of mobile home; and shows the purchase activity since 2009; charting the 3 month Moving average number of sales, and the 12 month Moving average.  This "smoothing" of the trend-data helps illustrate the short-term and longer term trends in Clark County's real estate market.

Disclaimer: as with any real estate statistics, we do our best to provide the best representation at the time the data was acquired and compiled.  The data and reports are deemed reliable but not guaranteed.
Friday, October 19, 2018

Clark County WA Real Estate Market Report - September 2018

Real Estate Sales Slowing Sharply in Clark County WA for September 2018.

Sales of existing homes has been taking a big hit of late, with this month's tally for Units-sold down a whopping 109 units compared to the same month last year! Here are the key highlights for this month: 

  • Average-Sales Prices are starting to fall, although still in positive territory with the 12-month/long-term trend line up 9.94% compared to last year at this time;  and the 3-Month Moving Average is up 7.77% from September last year; 
     
  • The Inventory for Resale Homes slipped to 2.2 Months Supply;
     
  • Approximately 527 Resale Homes closed in the month, which is about 109 fewer (-17.1%) homes than in 2017; and 154 fewer than last month.
     
  • REO/Bank Owned property sales were 3 units (0.6% of total); down from 10 (1.6%) in 2017. 
     
  • Short Sale /Pre-Foreclosure property sales were 2 units (0.4% of total); no change from 2 (0.3%) in 2017.

The month-end, 30-year-fixed home loan benchmark interest rate is 4.63% (up slightly from 4.55% last month) according to Freddie Mac; compared to 3.81% for September 2017.

The Unit-Volume chart shows both the short term (in red) and long term (12-month moving average in Blue) trends (shown below): 

Clark County Home Sales September 2018- Units Sold Clark County Home Sales - Units Sold Trend September 2018

With both trend-lines clearly moving lower from the peak seen in the past two years, the local market is looking for a new equilibrium.  With prices still rising at a pace above the long-term average, we still seem to be in a position of short-supply with respect to Buyer-Demand.

The next chart shows the trends for Average Home Sales Price, both the short-term and long-term: 

Clark County Home Sales September 2018- Average Sales Price Trends Clark County Home Sales - Average Sales Price Trend September 2018


The September short term Average sales price for Clark County is now up to $399,010; but down slightly from last month. This represents an increase of approximately $28,751 from the same month last year.

Our last set of graphs from RMLS show:

Charts of Vancouver WA Home Sales Trends in September 2018 Clark County Home Sales Inventory
& Days on Market - September 2018


New Listings, Pending Sales and Closed Sales all came in lower. Active Inventory however, eased slightly. 

The second graph with Prices for new listings and closed sales are still at a relatively high price level. 

Days on the Market: the Average dropped by several days; with the Median increasing by a few days. Both are in the zone we typically see week - again, very uncharacteristic for one of the usually best sales months of the entire year.

If you are interest the RMLS published report on the Clark County real estate scene can be found here: RMLS Market Action Report on our main website.


PS - The real estate market is adjusting to the much higher prices combined with higher loan costs however, there is still time to List and Sell Your Home with Our Team for 2018; or, at least find out what your home is worth!  We offer a no-cost, no-obligation Clark County WA Home Valuation, and invite you to try it out!

PPS - Looking to buy a home this year?  Interest rates are still at historically very low rates.  You are invited to visit our web-page for Clark County WA  Homes For Sale where it is Quite Easy to search by City, Neighborhood or by Category, with homes and real estate listings from the entire RMLS.  Sign-up Not Required!  The property and home listings shown are provided via many updates each day, and you will be e-mailed hourly with any new matches once you've signed up for a home search.

We also have the MLS Listings for these great towns in Clark County:  Battle Ground WA Real Estate | Brush Prairie WA Homes | Camas WA Homes For Sale | Hockinson WA Homes | La Center WA Homes for sale | Ridgefield WA Homes for sale | Homes for sale in Vancouver Washington | Washougal WA Real Estate | Yacolt WA Homes | Amboy WA Homes


The information and charts in this Clark County WA real estate update (prepared by Vancouver WA Real Estate Broker, John Slocum, CRS, SFR, our resident statistician) are based on home sales recorded in the Clark County WA MLS system (RMLS), excluding sales of mobile home; and shows the purchase activity since 2009; charting the 3 month Moving average number of sales, and the 12 month Moving average.  This "smoothing" of the trend-data helps illustrate the short-term and longer term trends in Clark County's real estate market.

Disclaimer: as with any real estate statistics, we do our best to provide the best representation at the time the data was acquired and compiled.  The data and reports are deemed reliable but not guaranteed.
Friday, October 5, 2018

Clark County WA Home Sales Report - August 2018

Disappointing Results for Home Sales in Clark County WA for August 2018.

Unit-volume sales are down 78 units when compared to the same month last year, with average sales prices starting to show softness. Here are the key highlights for this month: 
  • Average-Sales Prices are still in positive territory with the 12-month/long-term trend line up 10.36% compared to last year at this time;  and the 3-Month Moving Average is up 8.87% from August last year; 
     
  • The Inventory for Resale Homes notched up to 2.4 Months Supply;
     
  • Approximately 662 Resale Homes closed in the month, which is about 78 fewer (-10.54%) homes than in 2017; and 23 fewer than last month.
     
  • REO/Bank Owned property sales were 6 units (0.9% of total); down from 13 (1.8%) in 2017. 
     
  • Short Sale /Pre-Foreclosure property sales were 6 units (0.9% of total); up from 4 (0.5%) in 2017.
The month-end, 30-year-fixed home loan benchmark interest rate is 4.55% (up from 4.53% last month) according to Freddie Mac; compared to 3.88% for August 2017.

In the Unit-Volume chart below, the short term (in red) and long term (12-month moving average in Blue) trends are illustrated: 
Clark County Home Sales August 2018- Units Sold Clark County Home Sales - Units Sold Trend August 2018
This year the short-term trend is falling far short of the levels achieved in the prior three years; with the long-term trend clearly moving lower. This lower level of sales is consistent with the modest increase in available inventory.

The next chart for Average Sales Prices also describes the short-term and long-term trends for this measurement: 


Clark County Home Sales August 2018- Average Sales Price Trends Clark County Home Sales - Average Sales Price Trend August 2018

The August short term Average sales price for Clark County is now up to $400,376; but down slightly from last month . This is also an increase of about $32,617 from August last year.

Our remaining set of graphs (below) from RMLS show:
Charts of Vancouver WA Home Sales Trends in August 2018 Clark County Home Sales Inventory
& Days on Market - August 2018

Both New Listings and Pending Sales rose slightly, with Closed Sales coming in lower - actually quite a bit lower for this particular month. Active Inventory has been building with the slowdown in sales. 

The second graph shows Prices for both new listings and closed sales coming in lower than last month. 

Finally, for the Days on the Market, both the Average and the Median increased by almost a week - again, very uncharacteristic for one of the usually best sales months of the entire year.

If you are interest the RMLS published report on the Clark County real estate scene can be found here: RMLS Market Action Report on our main website.


PS - The real estate market is clearly changing, but there is still time to List and Sell Your Home with Our Team for 2018; or, at least find out what your home is worth!  We offer a no-cost, no-obligation Clark County WA Home Valuation, and invite you to try it out!

PPS - Looking to buy a home this year?  Interest rates are still at historically very low rates.  You are invited to visit our web-page for Clark County WA  Homes For Sale where it is Quite Easy to search by City, Neighborhood or by Category, with homes and real estate listings from the entire RMLS.  Sign-up Not Required!  The property and home listings shown are provided via many updates each day, and you will be e-mailed hourly with any new matches once you've signed up for a home search.

We also have the MLS Listings for these great towns in Clark County:  Battle Ground WA Real Estate | Brush Prairie WA Homes | Camas WA Homes For Sale | Hockinson WA Homes | La Center WA Homes for sale | Ridgefield WA Homes for sale | Homes for sale in Vancouver Washington | Washougal WA Real Estate | Yacolt WA Homes | Amboy WA Homes


The information and charts in this Clark County WA real estate update (prepared by Vancouver WA Real Estate Broker, John Slocum, CRS, SFR, our resident statistician) are based on home sales recorded in the Clark County WA MLS system (RMLS), excluding sales of mobile home; and shows the purchase activity since 2009; charting the 3 month Moving average number of sales, and the 12 month Moving average.  This "smoothing" of the trend-data helps illustrate the short-term and longer term trends in Clark County's real estate market.

Disclaimer: as with any real estate statistics, we do our best to provide the best representation at the time the data was acquired and compiled.  The data and reports are deemed reliable but not guaranteed.