Showing posts with label real estate for sale clark county wa. Show all posts

Friday, February 18, 2022

Clark County WA Real Estate For Sale - January 2022 Report

Real Estate Closed Sale Prices rise slightly; with Unit Sales Slowing being Constrained by Lack of Inventory for Clark County WA in January 2022.

Sales Prices rose modestly to achieve another new High. Seasonally we expect the number of Units-Sold per-month to be falling - although this year's number is much less than last year's - very likely due to the greatly reduced available Inventory for home buyers to shop. Here are the highlights for this month:  

  • Average-Sales Price moved up just over $4k+ finishing up at $555,946; with the 12-month/long-term trend line up 18.48% year-over-year;  and the 3-Month Moving Average up 18.05% from this time last year; 
     
  • The Inventory for Resale Property moved up only 0.1 Month's worth, ending at the super-low 0.3 Month's worth of Supply;
     
  • Approximately 390 Resale Properties were sold/closed, which is about 42 less (9.72%) properties than in 2021; and 276 fewer than last month;
     
  • REO/Bank Owned property sales were 0 units (0% of total); down from 2 (0.46%) in 2021; 
     
  • Short Sale /Pre-Foreclosure property sales were 0 units (0% of total); no change from 0 (0%) last year.

The Freddie Mac's report on the 30-year-fixed mortgage loan interest rate (nationwide average) at month-end, rose strongly ending at a monthly average of 3.45% ; compared to 2.74% for January 2021. Rates have risen strongly this first month of the year, and are expected to have continued upward pressure in the near term.

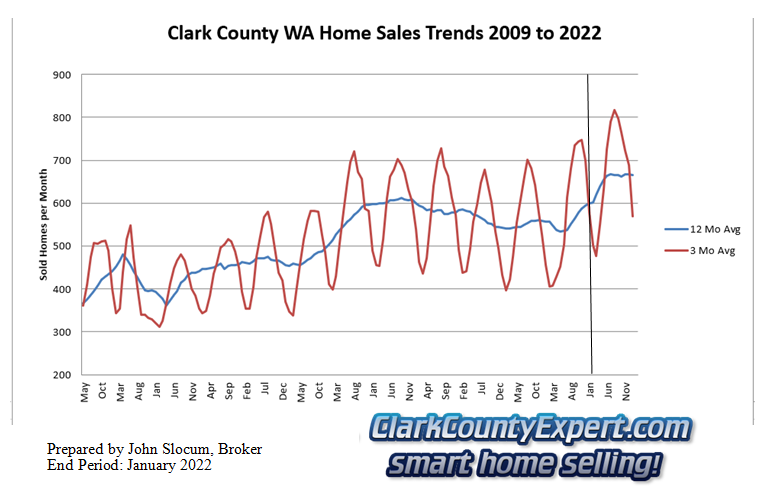
Next up is a Custom Chart (below) I created to show Property-Sales Unit-Volume (number of properties sold) with short term (in Red) and long term (12-month moving average in Blue) trends: 
Clark County Home Sales January 2022- Units Sold Clark County Real Estate - Units Sold Trend January 2022

The short-term trend is both in the stronger-part of its seasonal decline, compounded by the much lower level of closings seen from the dearth of Inventory. The long-term trend-line is stubbornly in a plateau however, this cannot last much longer at a continued slower pace of sales. This month's sales for the County is behind last year's total home sales by 42 properties (-9.72%).

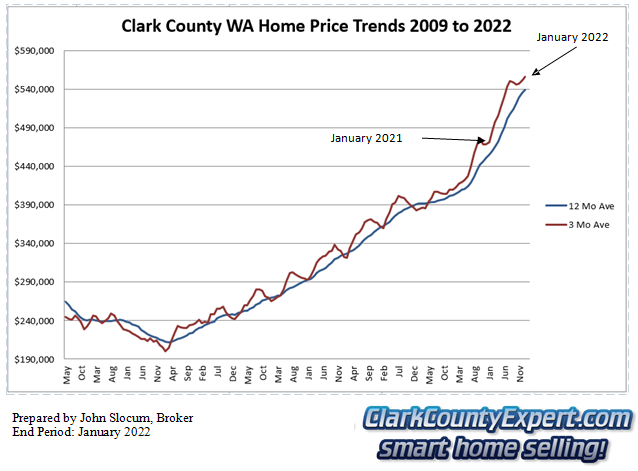
Continuing on is my chart showing the Average Real Estate Sales Price, the short-term line climbing slightly to a new high; with the long-term trend also moving up to a new high: 
Clark County Home Sales January 2022- Average Sales Price Trends Clark County Real Estate Sales - Average Sales Price Trend January 2022

Clearly Prices over the past 12 months have risen strongly overall at a pace not far under 20%. With Interest rates jumping up recently, we expect prices to be facing stronger headwinds in the near-term.
 
Clark County's Average Residential Property Sales Price (using the most recent 3 months) is now $555,946; which is approximately $85,025 (+18.05%) higher than this time last year.

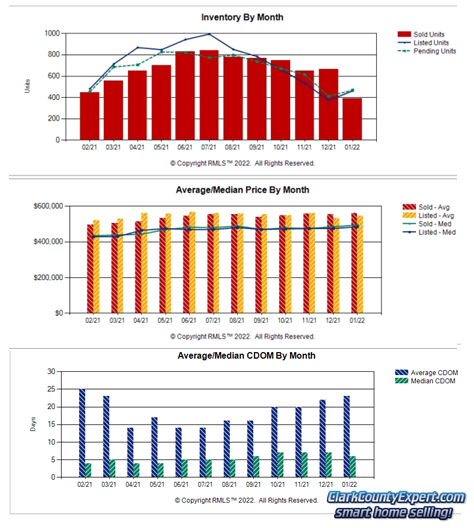
The remaining collection of graphs for this real estate sales report come from RMLS and show:
Charts of Vancouver WA Home Sales Trends in January 2022 Clark County Real Estate Sales Inventory
& Days on Market - January 2022


New Listings and  Pending Sales both rose at about the same pace this month; with Closed Sales quite a bit lower than the previous month. With New Listings not moving up strongly so far,  Active Inventory only moved slightly up to 0.3 month's of supply. 

The second graph shows the Average Price for Closed Sales hitting a new high; and the Average Listing Price coming in modestly below that number.

Finally, the Average Days on Market increased by 1 day finishing at 23 days; and Median Days on Market fell one day ending at 6 days. The pace of this market is still quick for this typically slower time of year.  

Thank you for visiting our Real Estate Market Report for Clark County WA. Please let me know if you have any questions or need help with your home or condo sale or purchase in 2022!


PS - The real estate market is changing, prices are still rising, with loan costs now Rising, this may be an excellent time to List and Sell Your Property with Our Team; or, at least find out what your property is worth!  We offer a no-cost, no-obligation Clark County WA Property Valuation, and invite you to try it out!

PPS - Looking to buy a property reasonably soon?  Interest rates are still at historically low rates.  You are invited to visit our web-page for Clark County WA Real Estate For Sale where it is Quite Easy to search by City, Neighborhood or by Category, with homes and real estate listings from the entire RMLS.  Sign-up Not Required!  The property and home listings shown are provided via many updates each day, and you will be e-mailed hourly with any new matches once you've signed up for a home search.

We also have the MLS Listings for these great towns in Clark County:  Battle Ground WA Real Estate For Sale | Brush Prairie WA Homes For Sale | Camas WA Homes for Sale | Hockinson WA Homes For Sale | La Center WA Homes for sale | Ridgefield WA Homes for sale | Real Estate for sale in Vancouver Washington | Washougal WA Real Estate | Yacolt WA Homes For Sale | Amboy WA Homes For Sale


The information and charts in this Clark County WA real estate update (prepared by Clark County WA Real Estate Sales Realtor, John Slocum, SFR, our resident statistician) are based on home sales recorded in the Clark County WA MLS system (RMLS), excluding sales of mobile home; and shows the purchase activity since 2009; charting the 3 month Moving average number of sales, and the 12 month Moving average.  This "smoothing" of the trend-data helps illustrate the short-term and longer term trends in Clark County's real estate market.

Disclaimer: as with any real estate statistics, we do our best to provide the best representation at the time the data was acquired and compiled.  The data and reports are deemed reliable but not guaranteed.

Tuesday, January 12, 2021

Real Estate for sale Clark County WA - December 2020

Unseasonably-Strong Real Estate Property-Sales While Sales Prices End the Year-2020 at Near Record for Clark County WA in December 2020.

The Pace of Property sales was one of the fastest this past 12 months; while the extremely low level of active Inventory contracted again! Here are the highlights for this month:  

  • Average-Sales Price eased by about $8k finishing up at $468,757; with the 12-month/long-term trend line up 12.27% year-over-year;  and the 3-Month Moving Average up 14.34% from this time last year; 
     
  • The Inventory for Resale Property fell again and finished at 0.5 Month's worth of Supply;
     
  • Approximately 600 Resale Properties were sold/closed, which is about 145 more (31.9%) properties than in 2019; although 66 fewer than last month;
     
  • REO/Bank Owned property sales were 4 units (0.67% of total); up from 2 (0.44%) in 2019; 
     
  • Short Sale /Pre-Foreclosure property sales were 1 units (0.17% of total); down from 2 (0.44%) last year.

The Freddie Mac's report on the 30-year-fixed mortgage loan interest rate (nationwide average) at month-end, fell again to a monthly average of 2.68% (another All-Time Low!); compared to 3.72% for December 2019. The Annual 2020 Average came in at 3.11% - compared to 2019's number of 3.94%!

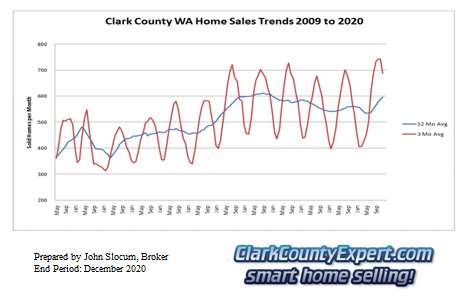
For the Property-Sales Unit-Volume (number of properties sold) with short term (in Red) and long term (12-month moving average in Blue) trends I've prepared this chart: 

Clark County Home Sales December 2020- Units Sold Clark County Real Estate - Units Sold Trend December 2020

With continued strong late-season property sales the short-term line is at a much higher level, though declining, than we typically see at the end of the year. Long-term the trend-line continues moving up nearing its all-time high. Finishing the year the County is now ahead of last years total home sales by 271 homes (or, 4.03%).

This month the Average Real Estate Sales Price tread-water (less than $300 difference from last month) in the near-term; while long-term the trend is still very positive: 

Clark County Home Sales December 2020- Average Sales Price Trends Clark County Real Estate Sales - Average Sales Price Trend December 2020

This year real estate prices have risen farther than they have at any time since the market "bottom" at January 2012." In fact, even with the super-low financing rates the Impact to Affordability will be very hard to ignore in the present and coming months to come.
 
Clark County's Average Home Sales Price (using the most recent 3 months) is now $468,757; which is approximately $58,799 (+14.34%) higher than this time last year.

My final charts for our real estate sales report come from RMLS and show:

Charts of Vancouver WA Home Sales Trends in December 2020 Clark County Real Estate Sales Inventory
& Days on Market - December 2020


New Listings dropped to post its lowest mark for the past 12 months. Pending Sales also came in lower to its second-lowest mark for the year. Closed Sales eased but stayed at a relatively high level. Active Inventory at 0.5 month's of supply is extremely low, making it tough on home shoppers that once had an easier time at the end of the year. 

The second graph shows the Average Price for Closed Sales at its second-highest level for the year; and Average Listing Price came in lower than the closed-sales price.

Finally, the market pace was about the fastest for the year; with the Average Days on Market falling by 6 days; while the Median Days on the Market fell one day. This rapid-paced market is unprecedented in my experience.

Thank you for visiting our Real Estate Sales Report for Clark County Washington. Please let me know if you have any questions or need help with your home or condo sale or purchase!


PS - The real estate market is changing, prices are still rising, with loan costs presently at RECORD low levels, keeping this an excellent time to List and Sell Your Property with Our Team; or, at least find out what your property is worth!  We offer a no-cost, no-obligation Clark County WA Property Valuation, and invite you to try it out!

PPS - Looking to buy a property reasonably soon?  Interest rates are still at historically low rates.  You are invited to visit our web-page for Clark County WA Real Estate For Sale where it is Quite Easy to search by City, Neighborhood or by Category, with homes and real estate listings from the entire RMLS.  Sign-up Not Required!  The property and home listings shown are provided via many updates each day, and you will be e-mailed hourly with any new matches once you've signed up for a home search.

We also have the MLS Listings for these great towns in Clark County:  Battle Ground WA Real Estate For Sale | Brush Prairie WA Homes For Sale | Camas WA Homes for Sale | Hockinson WA Homes For Sale | La Center WA Homes for sale | Ridgefield WA Homes for sale | Real Estate for sale in Vancouver Washington | Washougal WA Real Estate | Yacolt WA Homes For Sale | Amboy WA Homes For Sale


The information and charts in this Clark County WA real estate update (prepared by Vancouver WA Real Estate Sales Realtor, John Slocum, SFR, our resident statistician) are based on home sales recorded in the Clark County WA MLS system (RMLS), excluding sales of mobile home; and shows the purchase activity since 2009; charting the 3 month Moving average number of sales, and the 12 month Moving average.  This "smoothing" of the trend-data helps illustrate the short-term and longer term trends in Clark County's real estate market.

Disclaimer: as with any real estate statistics, we do our best to provide the best representation at the time the data was acquired and compiled.  The data and reports are deemed reliable but not guaranteed.
Friday, July 7, 2017

Clark County Real Estate - May 2017 Report

Inventory of Active Listings Improves Slightly for Clark County WA's Real Estate Market.

With the local real estate market in the height of activity for this year, the number of sales is off about 6% year-to-date.  Low Inventory and Higher Prices are the likely cause. Here are some of the highlights for May's results: 
  • Average-Sales Prices are higher, with the 12-month/long-term trend line up 9.86% compared to May 2016,  and the 3-Month Moving Average  is up 10.18% from last year; 
     
  • The Inventory for Resale Homes has been creeping up and is now at a still-low 1.6-Months Supply;
     
  • Approximately 646 Resale Homes were sold in the month, which is about 9 fewer (-1.4%) homes than in 2016.
     
  • REO/Bank Owned property sales were 14 units (2.2% of total); down from 15 (2.3%) in 2016. 
     
  • Short Sale /Pre-Foreclosure property sales were 13 units (2.0% of total); down from 20 (3.1%) in 2016.
The month-end, 30-year-fixed home loan benchmark interest rate is 4.01% (down from 4.05% last month) according to Freddie Mac; compared to 3.60% for May 2016. The recent rate "actions" by the Federal Reserve don't necessarily translate into increases in the Home Loan / Mortgage financing rates.

Our custom graphs/charts for Clark County WA that will help tell the rest of this real estate market's story. We apply a simple "smoothing" technique to better present the short-term trend (3-month moving average in Red); and long-term trend (12-month moving average in Blue). 
Clark County Home Sales May 2017- Units Sold Clark County Home Sales - Units Sold Trend May 2017
Unusual this year is that this is typically the month where we see the short-term line break-through the blue line.  Maybe next month for this indicator?  With the extremely low level of inventory it makes sense that the long-term line will be going sideways or downwards.

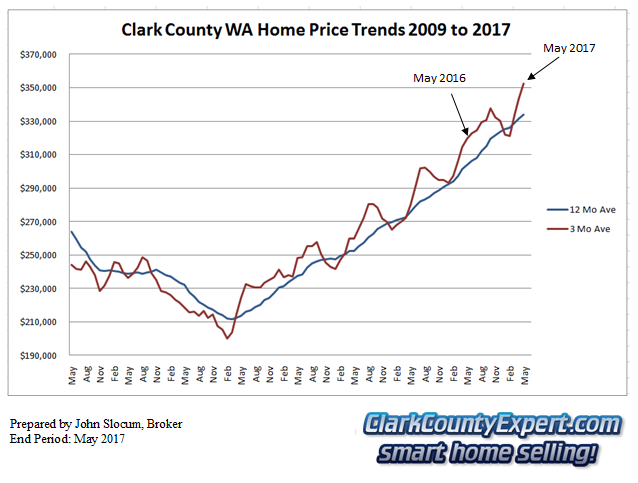
Moving to the next chart: Average Sales prices (shown below) are strongly rising, as the demand for homes to purchase has not abated much. 


Clark County Home Sales May 2017- Average Sales Price Trends Clark County Home Sales - Average Sales Price Trend May 2017

The May short term Average sales price for Clark County is now up to $352,262.  This is an increase of about $32,559 from the same month last year.

Charts of Vancouver WA Home Sales Trends in May 2017 Clark County Home Sales Inventory
& Days on Market - May 2017

These final graphs from RMLS show:

Both New Listings and Pending Sales, are rising at an almost evenly matched pace.  The result is that the inventory level is not improving very much.

The second graph shows the continued strong pressure on the average price of new listings.

Finally, for the Days on the Market, as measured by the average and median Days on Market has dropped moderately for the Average, and is in an extremely low level for the Median.

More information from the RMLS published report on the Clark County real estate scene can be found here: RMLS Market Action Report on our website.


PS - This is an Excellent Time to Sell Your Home; or, at least find out what your home is worth!  We offer a no-cost, no-obligation Clark County WA Home Valuation, and invite you to try it out!

PPS - You are invited to visit our web-page for Clark County WA  Homes For Sale where it is Quite Easy to search by City, Neighborhood or by Category, with homes and real estate listings from the entire RMLS.  Sign-up Not Required!  The property and home listings shown are provided via many updates each day, and you will be e-mailed hourly with any new matches once you've signed up for a home search.

We also have the MLS Listings for these great towns in Clark County:  Battle Ground WA Homes | Brush Prairie WA Homes | Camas WA Homes | Hockinson WA Homes | La Center WA Homes | Ridgefield WA Homes | Vancouver WA Homes | Washougal WA Homes | Yacolt WA Homes | Amboy WA Homes


The information and charts in this Clark County WA real estate update (prepared by Vancouver WA Realtor, John Slocum, CRS, SFR, our resident statistician) are based on home sales recorded in the Clark County WA MLS system (RMLS), excluding sales of mobile home; and shows the purchase activity since 2009; charting the 3 month Moving average number of sales, and the 12 month Moving average.  This "smoothing" of the trend-data helps illustrate the short-term and longer term trends in Clark County's real estate market.

Disclaimer: as with any real estate statistics, we do our best to provide the best representation at the time the data was acquired and compiled.  The data and reports are deemed reliable but not guaranteed.