Clark County Home Sales Rally of 2011 Continues with a Good Showing in September
From the beginning of 2011, Homes and Real Estate Sales volume in Vancouver WA and Clark County have shown regular improvement, either on a month-over-month basis; or, when compared to the same results in 2010. However, sales prices have taken a while to respond but, have finally done so in a positive manner.One very important consideration we must take care of early is the impact the Federal Home Buyer Tax Credit had on the sales volume and prices during 2010, and perhaps into 2011. With the eligibility for the tax credit expiring in the first half of 2010, we saw many home shoppers move up their purchases from just a few months, and on up to a year sooner for others. This created an
artificially higher volume of sales in early 2010; high enough to provide support for the otherwising falling home values; along with a much lower volume of sales for the six or more months following the expiry.
When the tax credit incentive were in-place, homes purchased effectively cost less to the eligible purchaser. Last Summer,the removal of the Incentive caused home prices to fall so that home prices are now Less; probably so much lower that it may be that those who waited until this year obtained a much better net price.
That said, on to our report. This information is based on home sales entered into the Vancouver MLS system (RMLS), and exclude sales of mobile homes.
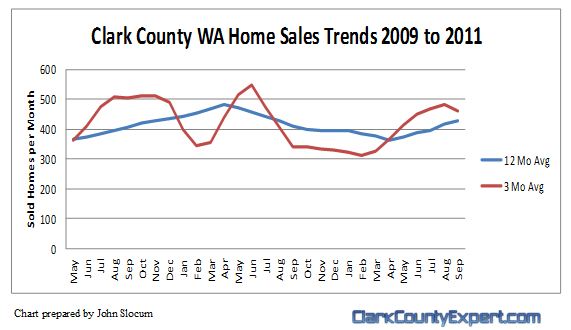
For the first 9 months of 2011 we show 3,702 closed sales; compared to 3,722 for the same period in 2010. If this trend continues for the last 3 months of 2011 (and it should), we expect that 2011 will post a higher sales volume than in 2011.
The Chart Below (prepared by John Slocum, our resident statistician) shows the purchase activity since 2009; charting the 3 month rolling average of sales, and the 12 month rolling average. This simple "smoothing" of the data better helps illiustrate the short-term and longer term trends in the Clark Conuty real estate market.

The next chart below shows the Average home sales price trends (3 month and
12 month) for the same time period. As you can see, with the extended
higher level of purchasing activity we are finally seeing some support building
in the past 3 months for home sales prices.

One final statistic we'll discuss here is the Inventory Level. We find that a very high percentage of the "New" homes listing in the MLS are merely prospective homes to be built and thus, we have no good way to scrub out these "phantom homes" from the actual finished or near-finished product.
Therefore, in search of a meaningful Inventory Statistic, we run the report excluding homes built in 2011. The result is our best approximation of a Resold Home Inventory calculation of 5.8 months -- a number that is substantially lower than last year, and another indication that home prices could rise with a continued higher level of demand.
Please let us know if you have any specific questions or comments!
Disclaimer: as with any real estate statistics, we do our best to provide the best representation at the time the data was acquired. We deem the data and reports reliable but not guaranteed.
No comments:
Post a Comment