Homes For Sale in Camas WA turn in Strong Gains for 2014
In an about-face from the Fourth Quarter 2013's major price dip, the Fall of 2014 average sales price fell slightly; finishing the year with excellent improvement in Average Sales price and level of Distressed Properties. Here are some of the highlights for 2014:
- REO/Bank Owned property sales were 30 units (6.71% of total); down from
40 (8.58%) in 2013.
- Short Sale /Pre-Foreclosure property sales were 19 units (4.25% of
total); down from 49 (10.52%) in 2013.
- Prices Indexes Were Strongly Up, with the 3-Month Moving
Average Up 27.6% (Dec13 vs. Dec14); while the 12-Month Moving Average went up
10.8%
- The Inventory level for Resale Homes is at 2.4 Months - going still
farther into the
range of a Strong "Seller's Market."
- Approximately 447 Resale Homes closed in 2014, compared to 466 Sold in 2013;
a decrease of 19 homes or, -4.25%.
The Big news is absolutely the ever shrinking inventory of Resale Homes in the Camas real estate market area. A "Normal" market is 6 months of Inventory (amount of homes available for sale in the market) -- when the home inventory is at 2.4 months it leaves fewer choices for Home Shoppers, and applies upward pressure on prices.
Moreover, with the inventory level at this low level, it will also cause many
home shoppers to expand their geographic search area; and in this case, to
include nearby areas such as
Vancouver WA Homes For Sale and
Washougal Homes For Sale.
Now for charts from RMLS:
This collection of 3 charts from RMLS illustrate the dynamics for Units Sold, List and Sales Price Averages; and Cumulative Days on Market (CDOM). The top chart shows a surge of new listings in the Spring through Summer, then tapering down for the rest of the year; with a very significant number of closings taking place in October (an amount we'd more typically expect in the summer months.). The next chart is showing that the new listings are pulling up the Average Listed price, with the buyer's in there unable to negotiate down. The final graph shows the relatively short time to sell a Camas home early in the year, with the market time appearing more "normal" in the final four months.
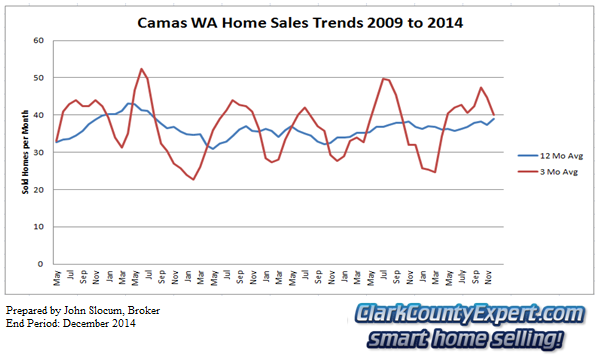
Now for John's Camas Charts! - The
first custom chart represents the number of Resale Homes Sold (Excludes New
Construction), with the short term trend line (in Red) calculated as a 3-Month
Moving Average; and the long term trend line (Blue line) equaling the 12-month
Moving Average.
This chart shows slight change in unit-home sales for Camas, while the Vancouver WA home sales trend is up for the year.
Moving to the current results for Average Home Prices (chart below), the short term trend-line shows that Camas jumped up strongly starting early in the year; and with low inventory the buyers have had no choice but to push prices higher. The long-term trend line also shows a upward price-change direction.
Please contact me if you have any questions with this report!
PS - Please visit my website for the
Camas Home and Real Estate page, where we have 16 neighborhood searches already set up
in addition to 7 category searches, with property listings from the entire
RMLS.
PPS - I believe Camas home sales will be strong
in 2015. Don't delay with your
Home Selling or Buying Plans - Call Us Soon!
The Camas Real Estate charts in this report (prepared by
Camas WA Realtor® John Slocum, our resident statistician)
are based
on home sales recorded in the Camas MLS system (RMLS), excluding sales of
mobile home; and shows
the purchase activity since 2009; charting the 3 month Moving average number of sales,
and the 12 month Moving average. This "smoothing" of the trend-data
helps illustrate the short-term and longer term trends in the Camas real estate market.
Disclaimer: as with any real estate
statistics, we do our best to provide the best representation at the time the
data was acquired. We deem the data and reports reliable but not
guaranteed.


