Thursday, December 8, 2016

Real Estate Market Report for Vancouver WA November 2016

Vancouver WA's Real Estate Sales Relatively Strong for November 2016!

With one month to go we are now on a pace to exceed 2015's lofty results; as we are ahead of last year by 74 units-sold . Highlights for this November include:

  • 392 Resale Homes were sold in November 2016, which is 62 More (18.7%) homes than were sold in November 2015.
     
  • The 3-Month Moving Average Price Trend Line has finally made its Seasonal Downward turn - now at 12.01% over the prior year at $304,303; and the 12-Month Moving Average is now up 11.24%, at $293,249.
      
  • Short Sale /Pre-Foreclosure property sales were at 3 units (0.8% of total); a big decrease compared to 8 (2.4% of total) in November of 2015.

  • REO/Bank Owned home sales were 10 units (2.53% of total); which is a bit less than 14 (4.2% of total) in November of 2015.
     
  • The Inventory for Resale Homes for November is again sharply down; now at 1.2 Months of Supply!

Given the large surge in home purchase in 2015 and early 2016, we have been wondering "How Much Longer can this Continue?"  With the extended closing intervals we've experienced in 2016 (unlike the once-common 30 day closings prior to October 2015), we think that many of the October and November Closings this year would have closed a month earlier under the Old Closing Rules.  Thus, we likely have one more month to wait before we see the seasonal slow-down set in.

The rest of our report is aided by our custom charts are displayed below.  The first one shows the Unit-Sales trends for the Short Term (red line) and Long Term (blue line) up to the current month.  

Vancouver Washington Resale Home Sales November 2016 - Units Sold Vancouver WA Resale Home Sales - Units Sold Trend November 2016


For twelve (12) months now the long-term number of units sold per month has stayed very close to 410, and this month it hit 414 - its highest level achieved..   

Next up is the chart showing the trend for the average sales-price. The results this month are the first time since the 2016 up-tick began that prices have shown any downward action.  We'll want to review this again next month to see if our strong-rising price environment will be easing.

Vancouver WA Resale Home Sales November 2016 - Average Sales Price Trends Vancouver WA Resale Home Sales - Average Sales Price Trend


This month 39 properties (9.9%) closed at $200,000 or less when sold; with 97 (24.6%) sold that were priced $200,000 to $250,000. In comparison with the 2015 measurement, 50.3% of the November 2015 sales were at $250k or below; while this November that reading is now at 34.5%.  

These final three charts shown below are from the Regional Multiple Listing Service and show the most recent 12 months real estate market action for Unit Sales, Average & Median Prices; and Days on Market:

RMLS Charts of Vancouver WA Resale Home Sales Trends in November 2016 Vancouver Resale Home Sales Inventory & Days on Market Trends


On a month-by-month basis the first chart indicates the relatively strong tally for Closings in the Autumn months.  

The second chart for this month is lets us see how the lower average sales price was low enough to cause the 3-month average line to bend downward.

And lastly, the Average Days on Market shows we're still in a brisk sales environment with the Average less than 40 days, and the Median just under 20 days. 

Thank you for visiting and reading our real estate market report for Vancouver Washington, and please contact us with any questions, or requests for assistance. 


PS - You owe it to yourself to visit our Homes For Sale in Vancouver WA page, or the separate page for Condos for sale in Vancouver WA.  We've put much custom work in to make it Easy for You to search by Neighborhood or by Category, with Homes  and real estate listings from the entire RMLS.  Sign-up Not Required!

Some of the Popular Searches include:  Cascade Park Homes; The Heights Homes; Felida Homes; Fishers Landing Homes; Hazel Dell / Lakeshore Homes; Minnehaha / Walnut Grove Homes; and Salmon Creek Homes.

We also have Category searches including: Acreage Homes Vancouver WA; Listing Real Estate Agent Vancouver WA; One-Level Ranch Homes for sale in Vancouver WA.

PPS -2016's real estate market action is setting records for the Vancouver WA.  If you ace planning on Selling or, just want to know what your home is worth -  we offer a no-cost, no-obligation Real Estate Home Price Report, and invite you to try it out!


This report and custom charts (prepared by John Slocum Realtor®, our resident statistician) are based on home sales posted in the Vancouver MLS system (RMLS), excluding sales of mobile home; and shows the purchase activity since 2009; charting the 3 month Moving average number of sales, and the 12 month Moving average.  This "smoothing" of the trend-data helps illustrate the short-term and longer term trends in Vancouver WA's real estate market.

Disclaimer: as with any real estate statistics, we do our best to provide the best representation at the time the data was acquired.  We deem the data and reports reliable but not guaranteed.

Sunday, December 4, 2016

Real Estate Market Report for Vancouver WA October 2016

Vancouver WA's Real Estate Sales Leveling in October 2016!

2016 has so far turned out to be one of the hottest years in real estate in the past decade.  We are perhaps seeing some leveling to the pace this month. Highlights for this October include:

  • 396 Resale Homes were sold in October 2016, which is 84 Fewer (-17.5%) homes than were sold in October 2015.
     
  • The 3-Month Moving Average Price Trend Line is pointing almost straight up - now at 16.1% over the prior year at $313,298; and the 12-Month Moving Average is now up 11.6%, at $292,035.
      
  • Short Sale /Pre-Foreclosure property sales were at 8 units (2.02% of total); a slight increase compared to 6 (1.25% of total) in October of 2015.

  • REO/Bank Owned home sales were 9 units (2.27% of total); which is much lower from 21 (4.6% of total) in October of 2015.
     
  • The Inventory for Resale Homes for October headed sharply down, and is now at 1.4 Months of Supply!

Autumn is the time of the year we typically see home sales slow - at least unit-volume-wise; and this year seems to be no different in that respect.  The short-term moving average for unit-sales has the current level at 4 homes per month higher than at the same time last year.  Are we at a market-top? - at this point it is hard to say.  

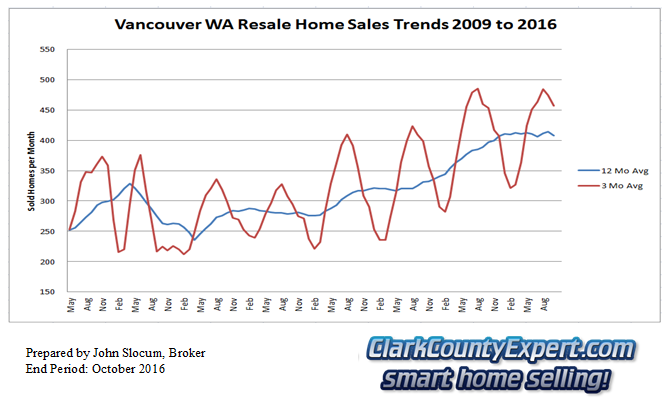
Our custom charts are displayed below, and the first one shows the Unit-Sales trends for the Short Term (red line) and Long Term (blue line) up to the current month.  

Vancouver Washington Resale Home Sales October 2016 - Units Sold Vancouver WA Resale Home Sales - Units Sold Trend October 2016


Seeing the long-term trend-line in a relatively narrow range for the past few months strongly suggests that we have reached the area's capacity limit for pre-owned home sales. Further confirming that view is the increasingly steep rise to the average sales price, as shown below.   

This next chart shows the trends for the average sales-price. We now see both the short-term and long-term trend-lines rising more steeply, with the short-term line in a relatively long, un-broken segment this year.

Vancouver WA Resale Home Sales October 2016 - Average Sales Price Trends Vancouver WA Resale Home Sales - Average Sales Price Trend


This month 52 properties (13.1%) closed at $200,000 or less when sold; with 113 (23.7%) sold that were priced $200,000 to $250,000. In comparison with the 2015 measurement, 51.7% of the October 2015 sales were at $250k or below; while this October that reading is now at 36.6%.  

The final three charts we show below are from the Regional Multiple Listing Service and show the most recent 12 months real estate market action for Unit Sales, Average & Median Prices; and Days on Market:

RMLS Charts of Vancouver WA Resale Home Sales Trends in October 2016 Vancouver Resale Home Sales Inventory & Days on Market Trends


The first chart clearly shows how the past 8 months the closed sales have been at about 400 units or better, with the New Listings dropping, as typical in the Autumn season.  

The second chart for this month is showing the strong upward spurt in the Average Sales price, which even exceeds the average new listing price for the month!

Finally, the Average Days on Market compares to last month at the same level, while the Median Days on Market moved up by several days. Still a fast-moving market. 

Thank you for visiting and reading our real estate market report for Vancouver Washington, and please contact us with any questions, or requests for assistance. 


PS - You are invited to visit our Homes For Sale in Vancouver WA page, or the separate page for Condos for sale in Vancouver WA.  We've tried hard to make it Easy for You to search by Neighborhood or by Category, with Homes  and real estate listings from the entire RMLS.  Sign-up Not Required!

Some of the Popular Searches include:  Cascade Park Homes; The Heights Homes; Felida Homes; Fishers Landing Homes; Hazel Dell / Lakeshore Homes; Minnehaha / Walnut Grove Homes; and Salmon Creek Homes.

We also have Category searches including: Acreage Homes Vancouver WA; Listing Realtor Vancouver WA; One-Level Ranch Homes for sale in Vancouver WA.

PPS -2016's real estate market action is setting records for the Vancouver WA.  If you ace planning on Selling or, just want to know what your home is worth -  we offer a no-cost, no-obligation Real Estate Home Price Report, and invite you to try it out!


This report and custom charts (prepared by John Slocum Realtor®, our resident statistician) are based on home sales posted in the Vancouver MLS system (RMLS), excluding sales of mobile home; and shows the purchase activity since 2009; charting the 3 month Moving average number of sales, and the 12 month Moving average.  This "smoothing" of the trend-data helps illustrate the short-term and longer term trends in Vancouver WA's real estate market.

Disclaimer: as with any real estate statistics, we do our best to provide the best representation at the time the data was acquired.  We deem the data and reports reliable but not guaranteed.

Friday, October 14, 2016

Real Estate Market Report for Vancouver WA September 2016

Extended Up-Market for Vancouver WA Real Estate Sales in September 2016!

The 2016 and 2015 sales seasons have been Epic for real estate sales in Vancouver WA, with the slight, quirky slow month of July has been turned-around in both August and now September. Highlights for this September include:

  • 445 Resale Homes were sold in September 2016, which is 6 More (1.4%) homes than were sold in September 2015.
     
  • The 3-Month Moving Average Price Trend Line is still going up - now at 12.9% over the prior year at $307,083; and the 12-Month Moving Average is now up 10.8%, at $287,590.
      
  • Short Sale /Pre-Foreclosure property sales were at 5 units (2.02% of total); a nice decrease compared to 14 (3.19% of total) in September of 2015.

  • REO/Bank Owned home sales were 9 units (2.02% of total); which is slightly lower from 14 (3.19% of total) in September of 2015.
     
  • The Inventory for Resale Homes for September headed back down, and is now at 1.6 Months of Supply!

This past summer home sales season has been very busy, to say the least!  Although the popular press has reported a slowdown, we think more correctly what we've seen is a backlog of sales that have not been processed in the more typical time-frames owing to a lack of Appraisers and other personnel to work the home loan / financing part of the equation. 

When using our charting of the Short Term that is a 3-month Average; and the Long Term which is a 12-month average, we can see that 2016 was just as strong a home sales year as was 2015.  

Our custom chart below shows the Unit-Sales trends for the Short Term (red line) and Long Term (blue line) up to the current month.  

Vancouver Washington Resale Home Sales September 2016 - Units Sold Vancouver WA Resale Home Sales - Units Sold Trend September 2016


With the long-term trend now going "sideways" (see above) for several months it shows that the unit-sales volume has not kept the upward pace of the past two years however, it has also not yet decreased such to see a downward trend.   

This next chart shows the trends for the average sales-price. Unlike last year's pause in the price rise at this time of the year, we are continuing to see strong upward momentum, and are clearly in record-setting territory.

Vancouver WA Resale Home Sales September 2016 - Average Sales Price Trends Vancouver WA Resale Home Sales - Average Sales Price Trend


This month 42 properties (9.3%) closed at $200,000 or less when sold; with 113 (25.1%) sold that were priced $200,000 to $250,000. In comparison with the 2015 measurement, 53.99% of the September 2015 sales were at $250k or below; while this September that reading is now at 34.4%.  

Shown below, the final three charts are from the Regional Multiple Listing Service and show the most recent 12 months real estate market action for Unit Sales, Average & Median Prices; and Days on Market:

RMLS Charts of Vancouver WA Resale Home Sales Trends in September 2016 Vancouver Resale Home Sales Inventory & Days on Market Trends


The first of three charts shows how closings have been consistent over the past seven months; and that this most recent month has a significant drop in New Listings.  

The second chart shows the variability on a month-to-month basis but, within that a general upward trend can be seen in the most recent months.

Although the sales pace slowed slightly for September, we are still in a time where home sales are occurring quite rapidly on average. 

Thank you for viewing our real estate market report for Vancouver Washington, and please contact us with any questions, or requests for assistance. 


PS - Please visit our Real Estate For Sale in Vancouver WA page, or the separate page for Condos for sale in Vancouver WA.  We've tried hard to make it Easy for You to search by Neighborhood or by Category, with Homes  and real estate listings from the entire RMLS.  Sign-up Not Required!

Some of the Popular Searches include:  Cascade Park Homes; The Heights Homes; Felida Homes; Fishers Landing Homes; Hazel Dell / Lakeshore Homes; Minnehaha / Walnut Grove Homes; and Salmon Creek Homes.

We also have Category searches including: Acreage Homes Vancouver WA; Listing Realtor Vancouver WA; One-Level Ranch Homes for sale in Vancouver WA.

PPS -2016's real estate market action is setting records for the Vancouver WA.  If you ace planning on Selling or, just want to know what your home is worth -  we offer a no-cost, no-obligation Real Estate Home Price Report, and invite you to try it out!


This report and custom charts (prepared by John Slocum Realtor®, our resident statistician) are based on home sales posted in the Vancouver MLS system (RMLS), excluding sales of mobile home; and shows the purchase activity since 2009; charting the 3 month Moving average number of sales, and the 12 month Moving average.  This "smoothing" of the trend-data helps illustrate the short-term and longer term trends in Vancouver WA's real estate market.

Disclaimer: as with any real estate statistics, we do our best to provide the best representation at the time the data was acquired.  We deem the data and reports reliable but not guaranteed.

Saturday, September 17, 2016

Vancouver WA Real Estate Market Report for August 2016

Unit-Volume Back on Track(?) for Vancouver WA Real Estate Sales in August 2016!

Following July's year-over-year drop of 68 units; August unit-sales were 35 more than August 2015. Anecdotally we've seen may financed transactions take two or more weeks longer to Close owing to Appraisal Delays and/or the TRiD Regulatory Delays.  Highlights for this August include:

  • 476 Resale Homes were sold in August 2016, which is 35 More (7.9%) homes than were sold in August 2015.
     
  • The 3-Month Moving Average Price Trend Line is still going up - now at 11.69% over the prior year at $303,803; and the 12-Month Moving Average is now up 10.73%, at $284,726.
      
  • Short Sale /Pre-Foreclosure property sales were at 5 units (1.1% of total); a nice decrease compared to 12 (2.7% of total) in August of 2015.
  • REO/Bank Owned home sales were 16 units (3.36% of total); which is slightly lower from 18 (4.1% of total) in August of 2015.
     
  • The Inventory for Resale Homes for August edged up again this month, and is now at 1.8 Months of Supply!

Recently the Federal Bureau of Labor and Statistics show positive job growth in the Portland / Vancouver metro area. Multnomah County has seen the strongest growth, with Clark County coming in at 0.7% (or, $6 per week). 

Increasing payrolls in the local area bode well for the local real estate market, is it is a borrowers income that allows a home loan to be paid; property taxes to be paid, etc.  Rising rents also motivate a wage-earner to step into the home-ownership action plan.  

Our custom chart below shows the Unit-Sales trends for the Short Term (red line) and Long Term (blue line) up to the current month. 


Vancouver Washington Resale Home Sales August 2016 - Units Sold Vancouver WA Resale Home Sales - Units Sold Trend August 2016

When looking at the long-term trend-line above (blue line) we can see that the dip in July was enough to send the line in the downward direction; while the "recovery" in August has been about enough to return the line to its previous level.   

This next chart shows the average sales-price trends. With several hundred fewer Active listings available for buyers, the resultant skyrocketing of sales prices has been the expected result.

Vancouver WA Resale Home Sales August 2016 - Average Sales Price Trends Vancouver WA Resale Home Sales - Average Sales Price Trend

This month 39 properties (8.2%) closed at $200,000 or less when sold; with 107 (22.5%) sold that were priced $200,000 to $250,000. In comparison with the 2015 measurement, 55.6% of the August 2015 sales were at $250k or below; while this August that reading is now at 30.7%.

The final three charts (below) are from the Regional Multiple Listing Service and show the most recent 12 months real estate market action for Unit Sales, Average & Median Prices; and Days on Market:

RMLS Charts of Vancouver WA Resale Home Sales Trends in August 2016 Vancouver Resale Home Sales Inventory & Days on Market Trends

The first graphic is showing the seasonal spread between New Listings and Pending Listings; and the actual month-by-month closed sales (red bars). 

The second chart shows the upward trend for average price for the new listings.

The last chart shows that the past six (6) months have had very brisk sales activity.

Thank you for viewing our report, and please contact us with any questions, or requests for assistance.

PS - You are welcome to visit our Homes For Sale in Vancouver WA page, or the separate page for Condos for sale in Vancouver WA.  We've tried hard to make it Easy for You to search by Neighborhood or by Category, with Homes  and real estate listings from the entire RMLS.  Sign-up Not Required!

Some of the Popular Searches include:  Cascade Park Homes; The Heights Homes; Felida Homes; Fishers Landing Homes; Hazel Dell / Lakeshore Homes; Minnehaha / Walnut Grove Homes; and Salmon Creek Homes.

A few of the Category searches include: Acreage Homes Vancouver WA; Listing Realtor Vancouver WA; One-Level Ranch Homes for sale in Vancouver WA.

PPS -2016's real estate market action is setting records for the Vancouver WA.  If you ace planning on Selling or, just want to know what your home is worth -  we offer a no-cost, no-obligation Real Estate Home Price, and invite you to try it out!


This report and custom charts (prepared by John Slocum Realtor®, our resident statistician) are based on home sales posted in the Vancouver MLS system (RMLS), excluding sales of mobile home; and shows the purchase activity since 2009; charting the 3 month Moving average number of sales, and the 12 month Moving average.  This "smoothing" of the trend-data helps illustrate the short-term and longer term trends in Vancouver WA's real estate market.

Disclaimer: as with any real estate statistics, we do our best to provide the best representation at the time the data was acquired.  We deem the data and reports reliable but not guaranteed.
Friday, July 29, 2016

Vancouver WA Real Estate Market Report June 2016

Rising Prices with Slowing Unit-Volume for Vancouver WA Real Estate Sales in June 2016!

Strongly rising sales prices in Vancouver, and even more so in Portland, OR, have been making national news as the fastest (in percentage) price-increase region in the nation. Highlights for June:

  • 488 Resale Homes were sold in June 2016, which is 28 FEWER (-5.4%) homes than were sold in June 2015.
     
  • The 3-Month Moving Average Price Trend Line is still going up - now at 10.88% over the prior year at $291,763; and the 12-Month Moving Average is now up 9.05%, at $277,718.
      
  • Short Sale /Pre-Foreclosure property sales were at 19 units (3.9% of total); a modest increased compared to 17 (3.3% of total) in June of 2015.

  • REO/Bank Owned home sales were 16 units (3.3% of total); which is substantially lower from 28 (5.4% of total) in June of 2015.
     
  • The Inventory for Resale Homes for June edged up again this month, and is now at 1.6 Months of Supply!

The Vancouver / Portland metro area are now at the top of the national list for fastest rising home prices!  The underlying reasons include: Popularity of this area for Retirees; Mild Weather; relatively Lowest Cost region of the entire West Coast,  

The initial custom chart below shows the Unit-Sales trends for the Short Term (red line) and Long Term (blue line).  

Vancouver Washington Resale Home Sales June 2016 - Units Sold Vancouver WA Resale Home Sales - Units Sold Trend June 2016


The the continued "flat or, level" nature of the long-term trend for unit-sales is a strong signal that our local market is now at capacity with respect to the available inventory of pre-owned homes. This ought to be a clear signal to home builders that it may be relatively safe at this time to continue building new residential homes.   

This next chart shows the price-trends. With unit-sales at a historically high level, the continued increase in prices is a logical outcome, as seen below.

Vancouver WA Resale Home Sales June 2016 - Average Sales Price Trends Vancouver WA Resale Home Sales - Average Sales Price Trend


This month 65 properties (13.3%) closed at $200,000 or less when sold; with 124 (25.4%) sold that were priced $200,000 to $250,000. In comparison with the 2015 measurement, 50.8% of the June 2015 sales were at $250k or below; while this June that reading is now at 38.7%.  

These last three charts (below) are from the Regional Multiple Listing Service and show the most recent 12 months real estate market action for Unit Sales, Average & Median Prices; and Days on Market:

RMLS Charts of Vancouver WA Resale Home Sales Trends in June 2016 Vancouver Resale Home Sales Inventory & Days on Market Trends


The first graphic is showing the seasonal spread between New Listings and Pending Listings. 

The second chart shows the average price for the new listings is continuing to be higher than what we've seen for prior months.

The last chart shows that the past 3 to 4 months have had very brisk sales activity.

Thank you for viewing our report, and please contact us with any questions, or requests for assistance. 


PS - You are welcome to visit our Homes For Sale in Vancouver WA page, or the separate page for Condos for sale in Vancouver WA.  We've tried hard to make it Easy for You to search by Neighborhood or by Category, with Homes  and real estate listings from the entire RMLS.  Sign-up Not Required!

Some of the Popular Searches include:  Cascade Park Homes; The Heights Homes; Felida Homes; Fishers Landing Homes; Hazel Dell / Lakeshore Homes; Minnehaha / Walnut Grove Homes; and Salmon Creek Homes.

A few of the Category searches include: Acreage Homes Vancouver WA; Listing Realtor Vancouver WA; One-Level Ranch Homes for sale in Vancouver WA.

PPS -2016's real estate market action is setting records for the Vancouver WA.  If you ace planning on Selling or, just want to know what your home is worth -  we offer a no-cost, no-obligation Online Home Valuation, and invite you to try it out!


This report and custom charts (prepared by John Slocum Realtor®, our resident statistician) are based on home sales posted in the Vancouver MLS system (RMLS), excluding sales of mobile home; and shows the purchase activity since 2009; charting the 3 month Moving average number of sales, and the 12 month Moving average.  This "smoothing" of the trend-data helps illustrate the short-term and longer term trends in Vancouver WA's real estate market.

Disclaimer: as with any real estate statistics, we do our best to provide the best representation at the time the data was acquired.  We deem the data and reports reliable but not guaranteed.

Monday, June 27, 2016

Real Estate Market Report Vancouver WA May 2016

Hot Prices with Strong Volume for Vancouver WA Home Sales in May 2016!

Rapidly rising sales prices are the big news for the Spring real estate season in Vancouver. Highlights for May include:
  • 426 Resale Homes were sold in May 2016, which is 5 (1.2%) more homes than were sold in May 2015.
     
  • The 3-Month Moving Average Price Trend Line is strongly up - now at 12.16% over the prior year at $288,066; and the 12-Month Moving Average is now up 9.37%, at $275,617.
      
  • Short Sale /Pre-Foreclosure property sales were at 15 units (2.2% of total); a huge decrease when compared to 22 (5.2% of total) in May of 2015.
  • REO/Bank Owned home sales were 14 units (3.3% of total); which is substantially lower from 33 (7.8% of total) in May of 2015.
     
  • The Inventory for Resale Homes for May edged up ever so slightly, and is now at 1.3 Months of Supply!
Vancouver, and the rest of Southwest Washington is challenged in the pre-owned home/condo market by more buyers than sellers.  We are continuing this season with the highest levels of closings, and rapid turnaround times than we've seen since the previous market peak. 

This first of our custom charts shows the Unit-Sales trends for the Short Term (red line) and Long Term (blue line).  
Vancouver Washington Resale Home Sales May 2016 - Units Sold Vancouver WA Resale Home Sales - Units Sold Trend May 2016

The short-term trend-line made its seasonal turn upwards at the highest level we've ever charted; although the long-term trend-line did flatten at the same time.  This long-term flattening suggests we've reached capacity in the inventory for resale homes.   

Next we have the price-performance for Vancouver market.  Clearly we are in the rarified air of record high prices, energized by a large pool of buyers, many using near record low interest rates.
Vancouver WA Resale Home Sales May 2016 - Average Sales Price Trends Vancouver WA Resale Home Sales - Average Sales Price Trend

46 properties (10.8%) closed at $200,000 or less when sold; with 111 (26.1%) sold that were priced $200,000 to $250,000. In comparison with the 2015 measurement, 53.9% of the May 2015 sales were at $250k or below; while this May that reading is now at 36.9%.

The final three charts (below) from the Regional Multiple Listing Service show the most recent 12 months real estate market action for Unit Sales, Average & Median Prices; and Days on Market:
RMLS Charts of Vancouver WA Resale Home Sales Trends in May 2016 Vancouver Resale Home Sales Inventory & Days on Market Trends

The first graphic is showing the seasonal spread between New Listings and Pending Listings. 

The second graphic is also showing that the average price for the new listings is significantly higher than what we've seen in the previous months.  New Sellers are likely trying to capture as much gain as they can, as this market has much momentum.

The final graphic shows that March was the turning point this year for the increased speed in transaction activity.

Thank you for viewing our report, and please contact us with any questions, or requests for assistance.

PS - You are welcome to visit our Homes For Sale in Vancouver WA page, or the separate page for Condos for sale in Vancouver WA.  We've tried hard to make it Easy for You to search by Neighborhood or by Category, with Homes  and real estate listings from the entire RMLS.  Sign-up Not Required!

Some of the Popular Searches include:  Cascade Park Homes; The Heights Homes; Felida Homes; Fishers Landing Homes; Hazel Dell / Lakeshore Homes; Minnehaha / Walnut Grove Homes; and Salmon Creek Homes.

A few of the Category searches include: Acreage Homes Vancouver WA; Vancouver WA Real Estate Listing Agents; One-Level Ranch Homes for sale in Vancouver WA.

PPS -2016's real estate market action is setting records for the Vancouver WA.  If you ace planning on Selling or, just want to know what your home is worth -  we offer a no-cost, no-obligation Free Home Market Analysis Vancouver WA, and invite you to try it out!


This report and custom charts (prepared by John Slocum Realtor®, our resident statistician) are based on home sales posted in the Vancouver MLS system (RMLS), excluding sales of mobile home; and shows the purchase activity since 2009; charting the 3 month Moving average number of sales, and the 12 month Moving average.  This "smoothing" of the trend-data helps illustrate the short-term and longer term trends in Vancouver WA's real estate market.

Disclaimer: as with any real estate statistics, we do our best to provide the best representation at the time the data was acquired.  We deem the data and reports reliable but not guaranteed.

Wednesday, April 13, 2016

Real Estate Market Update Vancouver WA March 2016

Moving up the Sales Price Increase in March 2016 for Vancouver WA!

With the resumption of the home shopping season in Vancouver WA, we are seeing an early arrival of the upswing in sales prices. March's highlights include:
  • 407 Resale Homes were sold in March 2016, which is 11 (2.8%) more homes than were sold in March 2015.
     
  • The 3-Month Moving Average Price Trend Line is moving significantly upwards - now up 11.97% over the prior year at $277,442; and the 12-Month Moving Average is now up 9.27%, at $270,494.
      
  • Short Sale /Pre-Foreclosure property sales were at 9 units (2.2% of total); a huge decrease when compared to 21 (5.3% of total) in March of 2015.
  • REO/Bank Owned home sales were 22 units (4.4% of total); down quite a bit from 43 (7.2% of total) in March of 2015.
     
  • The Inventory for Resale Homes for March edged up ever so slightly, and is now at 1.1 Months of Supply!
Vancouver, Clark County and Southwest Washington are facing the challenges of an extreme Seller's Market.  The visible evidence of this include: Increasing Sales Prices; Fewer than Average Days-On-Market; Very Low level of Available Inventory. 

We'll continue this month's analysis with our custom charts.  
Vancouver Washington Resale Home Sales March 2016 - Units Sold Vancouver WA Resale Home Sales - Units Sold Trend March 2016

The first chart (above) shows Unit-Sales for Vancouver. The effects of the low-inventory relative to demand, is showing in the large Short Term decrease in number of homes sold; with signs of perhaps a plateau being hit for the Long Term number (in blue).   

For this Winter's price-performance we have two items of note: First, the typical seasonal decrease looks to be relatively flat to slightly-downwind with an absence of a sharp downward move; and, Second - the resumption of the move upwards has now taken place in March, where previously March was the last month prior to the yearly move upwards.
Vancouver WA Resale Home Sales March 2016 - Average Sales Price Trends Vancouver WA Resale Home Sales - Average Sales Price Trend

62 properties (15.23%) closed at $200,000 or less when sold; with 126 (30.95%) sold that were priced $200,000 to $250,000. In comparison with the 2015 measurement, 64.90% of the March 2015 sales were at $250k or below; while this March that reading is now at 45.45%.

The final three charts (below) from the Regional Multiple Listing Service show the most recent 12 months real estate market action for Unit Sales, Average & Median Prices; and Days on Market:
RMLS Charts of Vancouver WA Resale Home Sales Trends in March 2016 Vancouver Resale Home Sales Inventory & Days on Market Trends

One of the first facts we see above are the very narrow spread between Listed Units and Pending Units for March - which suggests the low-inventory situation will not be changing as a result of the action this month. 

The Middle chart is showing that the Average List price for the recent new listings is now over $300,000; and also showing quite spread from the recent Closed sales price.  This could portend an acceleration to the price increases for this year.

The Bottom chart is showing March's Median Days on Market looks more like the hot performance turned in last June!

Thank you for viewing our report, and please contact us with any questions, or requests for assistance.

PS - You are welcome to visit our Homes For Sale in Vancouver WA page, or the separate page for Condos for sale in Vancouver WA.  We've tried hard to make it Easy for You to search by Neighborhood or by Category, with Homes  and real estate listings from the entire RMLS.  Sign-up Not Required!

Some of the Popular Searches include:  Cascade Park Homes; The Heights Homes; Felida Homes; Fishers Landing Homes; Hazel Dell / Lakeshore Homes; Minnehaha / Walnut Grove Homes; and Salmon Creek Homes.

A few of the Category searches include: Acreage Homes Vancouver WA; Vancouver WA Real Estate Listing Agents; One-Level Ranch Homes for sale in Vancouver WA.

PPS -2016 is setting records for the Vancouver WA real estate market.  Are you planning on Selling or, just want to know what your home is worth -  we offer a no-cost, no-obligation Vancouver WA Home Valuation Report, and invite you to try it out!


This report and custom charts (prepared by John Slocum Realtor®, our resident statistician) are based on home sales posted in the Vancouver MLS system (RMLS), excluding sales of mobile home; and shows the purchase activity since 2009; charting the 3 month Moving average number of sales, and the 12 month Moving average.  This "smoothing" of the trend-data helps illustrate the short-term and longer term trends in Vancouver WA's real estate market.

Disclaimer: as with any real estate statistics, we do our best to provide the best representation at the time the data was acquired.  We deem the data and reports reliable but not guaranteed.

Tuesday, March 29, 2016

Real Estate Market Update Vancouver WA February 2016

Pre-Owned Home Sales Challenged by Low Inventory in February 2016 for Vancouver WA !

While February 2016 saw the Vancouver market turn in a strong tally for closed Units-Sold, February is starting to see the strain caused by the incredibly low-level of available homes on the market.  February's highlights include:

  • 254 Resale Homes were sold in February 2016, which is 14 (-5.2%) fewer homes than were sold in February 2015.
     
  • The 3-Month Moving Average Price Trend Line is moving essentially sideways - now up 9.26% over the prior year at $270,081; and the 12-Month Moving Average is now up 8.79%, at $267,695.
      
  • Short Sale /Pre-Foreclosure property sales were only 8 units (3.1% of total); quite a decrease when compared to 11 (4.1% of total) in February of 2015.

  • REO/Bank Owned home sales were 16 units (6.3% of total); substantially down from 31 (11.6% of total) in February of 2015.
     
  • Available Inventory for Resale Homes at the end of February has essentially held steady, and now at 1.0 Months of Supply!

With such a tremendous surge of home sales in 2015, it is perhaps little surprise that at some point we'd start seeing down or erratic behavior in the unit-sales once we work through the inventory of homes where the sellers had previously delayed their sales plans. With only One Month of available inventory, combined with quite low levels of bank owned home sales and short sales; we think we've hit the point where prices can continue their upward trend even when unit sales don't break new records. 

The Vancouver WA real estate market has changed considerably since 2009, as the following charts show.  

Vancouver Washington Resale Home Sales February 2016 - Units Sold Vancouver WA Resale Home Sales - Units Sold Trend February 2016


The Unit-Sales chart (above) is clearly showing that the greatly reduced sales in February has been strong enough to cause the long-term average line (in blue) to sideways or slightly downwards - which is quite a change over its steady rise the past two-years.   

Unlike the typical seasonal dip in average sales prices, this year the "dip" has been extremely small - and looks more like sideways action, as seen below.

Vancouver WA Resale Home Sales February 2016 - Average Sales Price Trends Vancouver WA Resale Home Sales - Average Sales Price Trend


47 properties (18.51%) closed at $200,000 or less when sold; with 97 (38.2%) sold that were priced $200,000 to $250,000. In comparison with the 2014 measurement, 72.4% of the February 2015 sales were at $250k or below; while this February that reading is now at 56.7%.  

The final three charts (below) from the Regional Multiple Listing Service show the most recent 12 months real estate market action for Unit Sales, Average & Median Prices; and Days on Market:

RMLS Charts of Vancouver WA Resale Home Sales Trends in February 2016 Vancouver Resale Home Sales Inventory & Days on Market Trends


The Average List price has taken a significant jump higher this month.  Will we see much higher closed sales-prices a result?

Thank you for viewing our report, and please contact us with any questions, or requests for assistance. 


PS - You are welcome to visit our Homes For Sale in Vancouver WA page.  We've tried hard to make it Easy for You to search by Neighborhood or by Category, with Homes  and real estate listings from the entire RMLS.  Sign-up Not Required!

Some of the Popular Searches include:  Cascade Park Homes; The Heights Homes; Felida Homes; Fishers Landing Homes; Hazel Dell / Lakeshore Homes; Minnehaha / Walnut Grove Homes; and Salmon Creek Homes.

A few of the Category searches include: Acreage Homes Vancouver WA; Vancouver WA Real Estate Listing Agents; One-Level Ranch Homes for sale in Vancouver WA.

PPS -2016 is in record-setting territory for the Vancouver Washington real estate market.  If you are thinking of Selling or, just want to know what your home is worth -  we offer a no-cost, no-obligation Vancouver Washington Home Valuation Report, and invite you to try it out!


This report and custom charts (prepared by John Slocum Realtor®, our resident statistician) are based on home sales posted in the Vancouver MLS system (RMLS), excluding sales of mobile home; and shows the purchase activity since 2009; charting the 3 month Moving average number of sales, and the 12 month Moving average.  This "smoothing" of the trend-data helps illustrate the short-term and longer term trends in Vancouver WA's real estate market.

Disclaimer: as with any real estate statistics, we do our best to provide the best representation at the time the data was acquired.  We deem the data and reports reliable but not guaranteed.

Wednesday, March 23, 2016

Vancouver WA Condo Market Report February 2016

Vancouver WA Condo Market Inventory Running LOW in February 2016!

Luxury Riverview Condos at Riverside Condos in Vancouver WA

 With the very small number of condos and attached-style homes available to view by condo shoppers, Vancouver's condo market is very challenging at this time. Here are the highlights for January 2016:

  • Condo Average Sales Prices are in record setting territory, with the 3-Month Moving Average now at $206,785 closing up 16.09% over the prior January; and the 12-Month Moving Average closed up 6.54% from the prior year;
       
  • 34 Resale Condos were sold in February, which is about 5 (12.8%) fewer condos than in February 2015;
     
  • REO/Bank Owned Condo sales were 0 units (0% of total); down from 4 (10.3% of total) in February 2015.
     
  • Short Sale /Pre-Foreclosure property sales were 0 unit (0.0% of total); compared to 2 (5.1% of total) in February 2015.

A "First" for this report is this month's zero-count for both Bank-owned and Short Sale closings (although there are several short-sale pending listings, and a few pending bank-owned condos).  

The Custom Condo Charts we've prepared and shown below will help with the remainder of our report. 

Vancouver Washington Condo Sales February 2016 - Units Sold Vancouver WA Resale Condo Sales - Units Sold Trend February 2016

We should typically see February starting to show more closed units than the low in January however, with so many resale condos purchased last year, it should be no surprise that there will be fewer closed sales when there are fewer condos to purchase.

Average Condo Sales-Price levels are now in record setting territory (see below), starting the new year at a much higher position than expected..

Vancouver WA Condo Sales February 2016 - Average Sales Price Trends Vancouver WA Resale Condo Sales - Average Sales Price Trend


RMLS charts below illustrate the recent twelve (12) months of condo market results - through February 2016, for Unit Sales, Average & Median Prices; and Days on Market:

Charts of Vancouver WA Condo Sales Trends in February 2016 Vancouver Condo Sales Inventory & Days on Market Trends


From the above charts we see that the average list price for new listings is dramatically above both previous levels and above the closed-sales-price levels.  We also see that the most-recent Median Days on Market is at 8 Days - the lowest level seen in years!

Thanks for viewing our report on the Vancouver WA Condo Market.  Please contact us with any questions or comments; and to let us know how we can be of assistance!


PS - Please visit the Condos For Sale in Vancouver WA page at our website, where we have made it Easy to search by Neighborhood for Condos, with listings for condos from the entire RMLS.  You do not have to Sign-up to view Condominiums and Townhomes!

PPS - Don't wait any longer with your Condo Selling or Buying Plans - Call Us Soon!


The statistical charts for Vancouver WA Condos in this report (prepared by Vancouver WA Condo Realtor® John Slocum, our resident statistician) are based on condo sales recorded in the Vancouver MLS system (RMLS), excluding sales of newly constructed condos; and shows the purchase activity since 2009; charting the 3 month Moving average number of sales, and the 12 month Moving average.  The "smoothing" of the relatively sparse-data helps to better illustrate the short-term and longer term trends in Vancouver's Condominium market.

Disclaimer: as with all real estate statistics, we do our best to provide the best representation at the time the data was acquired.  We deem the data and reports reliable but not guaranteed.

Thursday, February 18, 2016

Home Sales Surge Ahead in January 2016 for Vancouver WA !

With the Resale / Pre-Owned Home Inventory ending the year at 1.1 months worth of inventory left, it gave us a great clue that January would not be typical in terms of average sales price but, we were surprised in other ways!  The highlights for the past month include:
  • 283 Resale Homes were sold in January 2016, which is 26 (10.1%) more homes than were sold in January 2015.
     
  • The 3-Month Moving Average Price Trend Line is moving very slightly upward - at a level now up 10.01% over the prior year at $270,265; and the 12-Month Moving Average up 8.63%, and now at $266,310.
      
  • Short Sale /Pre-Foreclosure property sales were only 7 units (2.5% of total); which is a substantial decrease when compared to 17 (6.6% of total) in January of 2015.
  • REO/Bank Owned home sales were 14 units (4.9% of total); quite a decrease from 25 (9.7% of total) in January of 2015.
     
  • Available Inventory for Resale Homes at the end of January has been shrunk again sitting now at 0.9 Months of Supply!
Many factors have been contributing to the very strong demand for homes in Vancouver; with the biggest two most likely being in-migration (Oregonians and Retirees are strong in this segment); household formation (first-time); and returning buyers (economic recovery). 

The historically low interest rates are also another strong factor in allowing home-buyers to qualify for a purchase and to purchase a more expensive property than they might have been able to afford.. 

The charts we have prepared below show the most recent action in Vancouver's market for pre-owned Homes, and how far this market has changed since 2009.  
Vancouver Washington Resale Home Sales January 2016 - Units Sold Vancouver WA Resale Home Sales - Units Sold Trend January 2016

Even though the unit-volume is much higher this January than in previous years at the same time we are still seeing the seasonal "waviness" to the 3-month (short-term) trend line.  The longer-term trend line (1-year) is showing a smooth and rather modest increase for almost 2 years running.   

For Average Sales Prices, the short term and long term trends are shown below.  This season the typical "downturn" is more like a "pause" in the more general up-trend; as shown by the short-term trend (in red); with the long-term trend-line keeping about the same slope to its upward direct.
Vancouver WA Resale Home Sales January 2016 - Average Sales Price Trends Vancouver WA Resale Home Sales - Average Sales Price Trend

52 properties (18.37%) closed at $200,000 or less when sold; with 105 (37.1%) sold that were priced $200,000 to $250,000. In comparison with the 2014 measurement, 70.0% of the January 2015 sales were at $250k or below; while this January that reading is now at 59.9%.

These last three charts (below) from the Regional Multiple Listing Service show the most recent 12 months real estate market action for Unit Sales, Average & Median Prices; and Days on Market:
RMLS Charts of Vancouver WA Resale Home Sales Trends in January 2016 Vancouver Resale Home Sales Inventory & Days on Market Trends

Of note this month is the big jump in the Average List Price (yellow-bar in middle chart). Does this portend a similar jump in the ultimate sales price?  Stay tuned and we shall see!

Thank you for viewing our report, and please contact us with any questions, comments or requests for assistance.

PS - You are welcome to visit our Homes For Sale in Vancouver WA page.  We've tried hard to make it Easy for You to search by Neighborhood or by Category, with Homes  and real estate listings from the entire RMLS.  Sign-up Not Required!

Some of the Popular Searches include:  Cascade Park Homes; The Heights Homes; Felida Homes; Fishers Landing Homes; Hazel Dell / Lakeshore Homes; Minnehaha / Walnut Grove Homes; and Salmon Creek Homes.

A few of the Category searches include: Acreage Homes Vancouver WA; Vancouver WA Real Estate Listing Agents; One-Level Ranch Homes for sale in Vancouver WA.

PPS -2015 has broken records for the Vancouver Washington real estate market.  Do You Have Home Selling or Buying Plans this Winter/Spring Season? - Call Us Right Away!


This report and custom charts (prepared by John Slocum Realtor®, our resident statistician) are based on home sales posted in the Vancouver MLS system (RMLS), excluding sales of mobile home; and shows the purchase activity since 2009; charting the 3 month Moving average number of sales, and the 12 month Moving average.  This "smoothing" of the trend-data helps illustrate the short-term and longer term trends in Vancouver WA's real estate market.

Disclaimer: as with any real estate statistics, we do our best to provide the best representation at the time the data was acquired.  We deem the data and reports reliable but not guaranteed.