Wednesday, March 23, 2016

Vancouver WA Condo Market Report February 2016

Vancouver WA Condo Market Inventory Running LOW in February 2016!

Luxury Riverview Condos at Riverside Condos in Vancouver WA

 With the very small number of condos and attached-style homes available to view by condo shoppers, Vancouver's condo market is very challenging at this time. Here are the highlights for January 2016:

  • Condo Average Sales Prices are in record setting territory, with the 3-Month Moving Average now at $206,785 closing up 16.09% over the prior January; and the 12-Month Moving Average closed up 6.54% from the prior year;
       
  • 34 Resale Condos were sold in February, which is about 5 (12.8%) fewer condos than in February 2015;
     
  • REO/Bank Owned Condo sales were 0 units (0% of total); down from 4 (10.3% of total) in February 2015.
     
  • Short Sale /Pre-Foreclosure property sales were 0 unit (0.0% of total); compared to 2 (5.1% of total) in February 2015.

A "First" for this report is this month's zero-count for both Bank-owned and Short Sale closings (although there are several short-sale pending listings, and a few pending bank-owned condos).  

The Custom Condo Charts we've prepared and shown below will help with the remainder of our report. 

Vancouver Washington Condo Sales February 2016 - Units Sold Vancouver WA Resale Condo Sales - Units Sold Trend February 2016

We should typically see February starting to show more closed units than the low in January however, with so many resale condos purchased last year, it should be no surprise that there will be fewer closed sales when there are fewer condos to purchase.

Average Condo Sales-Price levels are now in record setting territory (see below), starting the new year at a much higher position than expected..

Vancouver WA Condo Sales February 2016 - Average Sales Price Trends Vancouver WA Resale Condo Sales - Average Sales Price Trend


RMLS charts below illustrate the recent twelve (12) months of condo market results - through February 2016, for Unit Sales, Average & Median Prices; and Days on Market:

Charts of Vancouver WA Condo Sales Trends in February 2016 Vancouver Condo Sales Inventory & Days on Market Trends


From the above charts we see that the average list price for new listings is dramatically above both previous levels and above the closed-sales-price levels.  We also see that the most-recent Median Days on Market is at 8 Days - the lowest level seen in years!

Thanks for viewing our report on the Vancouver WA Condo Market.  Please contact us with any questions or comments; and to let us know how we can be of assistance!


PS - Please visit the Condos For Sale in Vancouver WA page at our website, where we have made it Easy to search by Neighborhood for Condos, with listings for condos from the entire RMLS.  You do not have to Sign-up to view Condominiums and Townhomes!

PPS - Don't wait any longer with your Condo Selling or Buying Plans - Call Us Soon!


The statistical charts for Vancouver WA Condos in this report (prepared by Vancouver WA Condo Realtor® John Slocum, our resident statistician) are based on condo sales recorded in the Vancouver MLS system (RMLS), excluding sales of newly constructed condos; and shows the purchase activity since 2009; charting the 3 month Moving average number of sales, and the 12 month Moving average.  The "smoothing" of the relatively sparse-data helps to better illustrate the short-term and longer term trends in Vancouver's Condominium market.

Disclaimer: as with all real estate statistics, we do our best to provide the best representation at the time the data was acquired.  We deem the data and reports reliable but not guaranteed.

Thursday, February 18, 2016

Home Sales Surge Ahead in January 2016 for Vancouver WA !

With the Resale / Pre-Owned Home Inventory ending the year at 1.1 months worth of inventory left, it gave us a great clue that January would not be typical in terms of average sales price but, we were surprised in other ways!  The highlights for the past month include:
  • 283 Resale Homes were sold in January 2016, which is 26 (10.1%) more homes than were sold in January 2015.
     
  • The 3-Month Moving Average Price Trend Line is moving very slightly upward - at a level now up 10.01% over the prior year at $270,265; and the 12-Month Moving Average up 8.63%, and now at $266,310.
      
  • Short Sale /Pre-Foreclosure property sales were only 7 units (2.5% of total); which is a substantial decrease when compared to 17 (6.6% of total) in January of 2015.
  • REO/Bank Owned home sales were 14 units (4.9% of total); quite a decrease from 25 (9.7% of total) in January of 2015.
     
  • Available Inventory for Resale Homes at the end of January has been shrunk again sitting now at 0.9 Months of Supply!
Many factors have been contributing to the very strong demand for homes in Vancouver; with the biggest two most likely being in-migration (Oregonians and Retirees are strong in this segment); household formation (first-time); and returning buyers (economic recovery). 

The historically low interest rates are also another strong factor in allowing home-buyers to qualify for a purchase and to purchase a more expensive property than they might have been able to afford.. 

The charts we have prepared below show the most recent action in Vancouver's market for pre-owned Homes, and how far this market has changed since 2009.  
Vancouver Washington Resale Home Sales January 2016 - Units Sold Vancouver WA Resale Home Sales - Units Sold Trend January 2016

Even though the unit-volume is much higher this January than in previous years at the same time we are still seeing the seasonal "waviness" to the 3-month (short-term) trend line.  The longer-term trend line (1-year) is showing a smooth and rather modest increase for almost 2 years running.   

For Average Sales Prices, the short term and long term trends are shown below.  This season the typical "downturn" is more like a "pause" in the more general up-trend; as shown by the short-term trend (in red); with the long-term trend-line keeping about the same slope to its upward direct.
Vancouver WA Resale Home Sales January 2016 - Average Sales Price Trends Vancouver WA Resale Home Sales - Average Sales Price Trend

52 properties (18.37%) closed at $200,000 or less when sold; with 105 (37.1%) sold that were priced $200,000 to $250,000. In comparison with the 2014 measurement, 70.0% of the January 2015 sales were at $250k or below; while this January that reading is now at 59.9%.

These last three charts (below) from the Regional Multiple Listing Service show the most recent 12 months real estate market action for Unit Sales, Average & Median Prices; and Days on Market:
RMLS Charts of Vancouver WA Resale Home Sales Trends in January 2016 Vancouver Resale Home Sales Inventory & Days on Market Trends

Of note this month is the big jump in the Average List Price (yellow-bar in middle chart). Does this portend a similar jump in the ultimate sales price?  Stay tuned and we shall see!

Thank you for viewing our report, and please contact us with any questions, comments or requests for assistance.

PS - You are welcome to visit our Homes For Sale in Vancouver WA page.  We've tried hard to make it Easy for You to search by Neighborhood or by Category, with Homes  and real estate listings from the entire RMLS.  Sign-up Not Required!

Some of the Popular Searches include:  Cascade Park Homes; The Heights Homes; Felida Homes; Fishers Landing Homes; Hazel Dell / Lakeshore Homes; Minnehaha / Walnut Grove Homes; and Salmon Creek Homes.

A few of the Category searches include: Acreage Homes Vancouver WA; Vancouver WA Real Estate Listing Agents; One-Level Ranch Homes for sale in Vancouver WA.

PPS -2015 has broken records for the Vancouver Washington real estate market.  Do You Have Home Selling or Buying Plans this Winter/Spring Season? - Call Us Right Away!


This report and custom charts (prepared by John Slocum Realtor®, our resident statistician) are based on home sales posted in the Vancouver MLS system (RMLS), excluding sales of mobile home; and shows the purchase activity since 2009; charting the 3 month Moving average number of sales, and the 12 month Moving average.  This "smoothing" of the trend-data helps illustrate the short-term and longer term trends in Vancouver WA's real estate market.

Disclaimer: as with any real estate statistics, we do our best to provide the best representation at the time the data was acquired.  We deem the data and reports reliable but not guaranteed.

Wednesday, February 3, 2016

Vancouver WA Condo Market Report for December 2015

Vancouver WA Condo Market Post Strong Sales in December 2015!

Luxury Waterfront Condos at the Meriwether in Vancouver WA

 Vancouver WA's Condo and Attached-Home market is experiencing an extreme shortage of available pre-owned units for sale!  Here are the highlights for December 2015:

  • Condo Average Sales Prices reversed the attempt at a seasonal downward direction and are now at the highest level seen in 3+ years, with the 3-Month Moving Average now at $203,354 closing up 4.26% over the prior December; and the 12-Month Moving Average closed up 4.26% from the prior year;
       
  • 53 Resale Condos were sold in December, which is about 5 (10.4%) More condos than in December 2014;
     
  • REO/Bank Owned Condo sales were 3 units (5.7% of total); down from 4 (8.3% of total) in December 2014.
     
  • Short Sale /Pre-Foreclosure property sales were 0 unit (0.0% of total); compared to 3 (6.25% of total) in December 2014.

 Condos + Attached-Homes are quite popular these days in the Vancouver market. We are now down to 0.8 months of supply for pre-owned condos; and have experienced 8 straight months where the Median Days on Market has been less than 20 Days!

We've prepared our Custom Condo Charts shown below to help tell the story! 

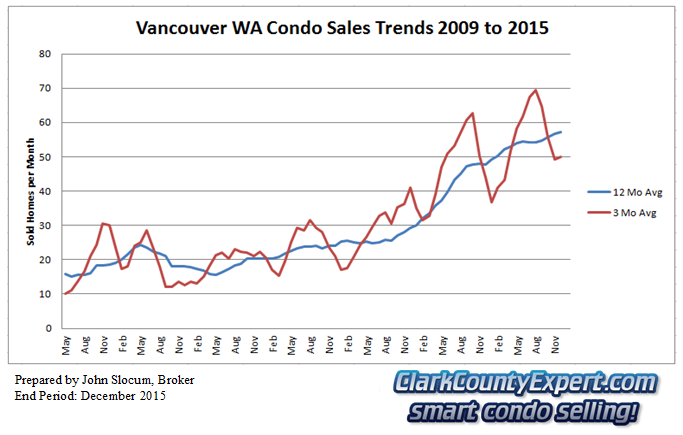
Vancouver Washington Condo Sales December 2015 - Units Sold Vancouver WA Resale Condo Sales - Units Sold Trend December 2015

This segment displayed the peak in the short-term number of units sold in August at 69, with the previous seasonal "turning point" in the prior January.  However, this season we appear to have made the turn in November!

Average Condo Sales-Price trends (shown below) for this month moved sharply upwards, and this makes sense they would with so few units available for sale. We expect the trend for the next few months to stay firm to increasing.

Vancouver WA Condo Sales December 2015 - Average Sales Price Trends Vancouver WA Resale Condo Sales - Average Sales Price Trend


The RMLS chats below illustrate the recent twelve (12) months of condo market results - through December 2015, for Unit Sales, Average & Median Prices; and Days on Market:

Charts of Vancouver WA Condo Sales Trends in December 2015 Vancouver Condo Sales Inventory & Days on Market Trends


We have now had eight (8) months with the Median Days on Market at the sub-20-day mark. This month's average sales price is also at the highest level for the past 12 months. With the average list price is less than the Sales price, it is clear we are seeing either Full-Price or Competitive Bids for the successful purchasers.

We hope you found this report on the Vancouver WA Condo Market to be helpful in your process to sell or buy in this market time.  Please contact us with any questions or comments; and to let us know how we can be of assistance!


PS - Please visit the Condominiums For Sale in Vancouver WA page at our website, where we have made it Easy to search by Neighborhood for Condos, with listings for condos from the entire RMLS.  You do not have to Sign-up to view Condominiums and Townhomes!

PPS - Don't wait any longer with your Condo Selling or Buying Plans - Call Us Soon!


The statistical charts for Vancouver WA Condos in this report (prepared by Vancouver WA Condo Realtor® John Slocum, our resident statistician) are based on condo sales recorded in the Vancouver MLS system (RMLS), excluding sales of newly constructed condos; and shows the purchase activity since 2009; charting the 3 month Moving average number of sales, and the 12 month Moving average.  The "smoothing" of the relatively sparse-data helps to better illustrate the short-term and longer term trends in Vancouver's Condominium market.

Disclaimer: as with all real estate statistics, we do our best to provide the best representation at the time the data was acquired.  We deem the data and reports reliable but not guaranteed.

Monday, January 25, 2016

Vancouver WA Real Estate Market Report December 2015

Resale Home Sales Complete a Record Year in December 2015 for Vancouver WA !

Vancouver WA real estate and home sales in December 2015 performed extremely well, capping off an over-the-top 12-month performance.  Highlights for the past month include:

  • 363 Resale Homes were sold in December 2015, which is 42 (13.1%) more homes than were sold in December 2014.
     
  • The Price Trend Lines show the 3-Month Moving Average moving very sligthly below the peak for the year! - now up 9.93% over the prior year at $270,085; and the 12-Month Moving Average up 8.64%, and now at $264,947.
      
  • Short Sale /Pre-Foreclosure property sales were only 10 units (2.8% of total); which is a substantial decrease when compared to 23 (7.2% of total) in December of 2014.

  • REO/Bank Owned home sales were 23 units (6.3% of total); quite a decrease from 33 (10.3% of total) in December of 2014.
     
  • Available Inventory for Resale Homes at the end of December has been shrunk again from 1.3 Months down to 1.1!

Unlike our typical report for December of past years, we have seen an increase in closed sales when compared to November; combined with prices holding relatively steady!  With fewer properties coming onto the market to replace those that have been sold in this sales-surge, there has been another strong decrease in the available inventory for home buyers to shop from. 

Another likely reason for December showing stronger results than November will be the longer interval required now for a financed transaction to close.  Two years ago a typical loan took 30 days to close; then, during the boom of 2015 that time-line stretched to about 40 days owing to the stretching of the capacity of Appraisers and Loan Processing & Underwriting.  Adding to the time-burden, the new federal disclosure rules for home loans is taking us out to 45 days or slightly longer to close a transaction with a home loan. 

The charts below show the most recent action in Vancouver's market for Existing Homes, and how far this market has changed since 2009.  

Vancouver Washington Resale Home Sales December 2015 - Units Sold Vancouver WA Resale Home Sales - Units Sold Trend December 2015


Three years ago Vancouver's sales volume broke out of its doldrums; which was again confirmed by last year's performance.  The unit-sales for 2015 have exceeded the peak for the 2 most recent years by a substantial margin!

Currently we are seeing the typical seasonal pattern with the number of homes sold retreating from their summer-seasin highs. With the inventory level so very low at this time, we would not be surprised if the short term trend line is seen above the long-term trend-line in the next month or two.   

The Average Sales Price Trend, shown in the chart below, is much stronger this year during the Winter season.  Like the short term trend for unit sales, we expect the short-term price trend to turn upwards again in the next month or two.

Vancouver WA Resale Home Sales December 2015 - Average Sales Price Trends Vancouver WA Resale Home Sales - Average Sales Price Trend


84 properties (23.1%) closed at $200,000 or less when sold; with 131 (36.1%) sold that were priced $200,000 to $250,000. In comparison with the 2014 measurement, 66.0% of the December sales were at $250k or below; while this December that reading is now at 59.2%.  

These last three charts (below) from the Regional Multiple Listing Service show the most recent 12 months real estate market action for Unit Sales, Average & Median Prices; and Days on Market:

RMLS Charts of Vancouver WA Resale Home Sales Trends in December 2015 Vancouver Resale Home Sales Inventory & Days on Market Trends


The msot telling of the 3 is the last chart, where the Days on Market for November and December are extremely low for this time of year - especially companed to the 2015 results for January and February!

Thank you for viewing our report, and please contact us with any questions, comments or requests for assistance. 


PS - Please visit our Homes  Listed For Sale in Vancouver WA page.  We've made it Easy to search by Neighborhood or by Category, with Homes  and real estate listings from the entire RMLS.  Sign-up Not Required!

Some of the Popular Searches include:  Felida Homes; Fishers Landing Homes; Cascade Park Homes; The Heights Homes; Hazel Dell / Lakeshore Homes; Minnehaha / Walnut Grove Homes; And Salmon Creek Homes.

A few of the Category searches include: Foreclosures Vancouver WA; Vancouver WA Short Sale Listing Agents; Lots and Land for sale in Vancouver WA.

PPS -2015 has broken records for the Vancouver Washington real estate market.  Do You Have Home Selling or Buying Plans this Autumn/Winter Season? - Call Us Right Away!


This report and custom charts (prepared by John Slocum Realtor®, our resident statistician) are based on home sales posted in the Vancouver MLS system (RMLS), excluding sales of mobile home; and shows the purchase activity since 2009; charting the 3 month Moving average number of sales, and the 12 month Moving average.  This "smoothing" of the trend-data helps illustrate the short-term and longer term trends in Vancouver WA's real estate market.

Disclaimer: as with any real estate statistics, we do our best to provide the best representation at the time the data was acquired.  We deem the data and reports reliable but not guaranteed.

Thursday, December 17, 2015

Vancouver WA Real Estate Market Report November 2015

Resale Home Inventory Shrinks Again in November 2015 for Vancouver WA !

Pressure on Sales-prices continued as the available supply of resale (pre-owned) homes shrinks to an extremely low level for Vancouver WA in November 2015.  Key elements to review for this past month:
  • 308 Resale Homes were sold in November 2015, which is 15 (5.1%) more homes than had sold in November 2014.
     
  • The Price Trend Lines show the 3-Month Moving Average reversing direction and trending upward again! - now up 10.92% over the prior year at $271,893; and the 12-Month Moving Average up 9.13%, and now at $263,610.
      
  • Short Sale /Pre-Foreclosure property sales were 7 units (2.27% of total); up 1 unit from last month; and a big decrease when compared to 17 (5.8% of total) in November of 2014.
  • REO/Bank Owned home sales were 13 units (4.2% of total); similar to last month but a nice decrease when compared to 31 (10.6% of total) in November of 2014.
     
  • Available Inventory for Resale Homes at the end of November has been reduced again and is now at 1.3 Months from 1.5 last month!
This local real estate market is still very much in the extreme end of the Seller's Market spectrum; as the nation-wide available inventory for resale homes is at 4.8 months (slightly into a seller's market) while Vancouver WA is currently at 1.3 months!  With our market in such an out-of-balance condition, the typical seasonal "decrease" in the average sales price is under severe pressure!

The charts below show how far Vancouver's market for Existing Homes has improved since 2009.  
Vancouver Washington Resale Home Sales November 2015 - Units Sold Vancouver WA Resale Home Sales - Units Sold Trend November 2015

The above chart for Units-Sold clearly show the increased level of activity for the past 12+ months.  The seasonal pattern is still evident in the 3-month line however, the turning-points have been much higher than in previous years.  For the year-to-date volume we are 738 homes (19.9%) above 2014's volume!   

Continuing with the chart below, one of the not-so-surprising results of the low inventory is slight up-tick for the short-term average sales price - which would typically be trending downward at this time of the year.  The long-term trend line is continuing upward at about the same rate of increase (positive slope) that it has show for the past three years.
Vancouver WA Resale Home Sales November 2015 - Average Sales Price Trends Vancouver WA Resale Home Sales - Average Sales Price Trend

58 properties (18.8%) closed at $200,000 or less when sold; with 97 (31.5%) sold that were priced $200,000 to $250,000. In comparison with the 2014 measurement, 62.8% of the November sales were at $250k or below; while this November that reading is now at 50.3%.

Finally, we have three charts (below) from the Regional Multiple Listing Service showing the recent real estate market action for Unit Sales, Average & Median Prices; and Days on Market:
RMLS Charts of Vancouver WA Resale Home Sales Trends in November 2015 Vancouver Resale Home Sales Inventory & Days on Market Trends

The string of seven (7) straight months has been broken where the Median Days on Market were less than 20 days; although the November results show a much quicker turn-around in market times than what we would expect to see for November.

Thank you for viewing our report, and please contact us with any questions, comments or requests for assistance.

PS - Please visit our Homes  Listed For Sale in Vancouver WA page.  We've made it Easy to search by Neighborhood or by Category, with Homes  and real estate listings from the entire RMLS.  Sign-up Not Required!

Some of the Popular Searches include:  Felida Homes; Fishers Landing Homes; Cascade Park Homes; The Heights Homes; Hazel Dell / Lakeshore Homes; Minnehaha / Walnut Grove Homes; And Salmon Creek Homes.

A few of the Category searches include: Foreclosures Vancouver WA; Vancouver WA Short Sale Listing Agents; Lots and Land for sale in Vancouver WA.

PPS -2015 has broken records for the Vancouver Washington real estate market.  Do You Have Home Selling or Buying Plans this Autumn/Winter Season? - Call Us Right Away!


This report and custom charts (prepared by John Slocum Realtor®, our resident statistician) are based on home sales posted in the Vancouver MLS system (RMLS), excluding sales of mobile home; and shows the purchase activity since 2009; charting the 3 month Moving average number of sales, and the 12 month Moving average.  This "smoothing" of the trend-data helps illustrate the short-term and longer term trends in Vancouver WA's real estate market.

Disclaimer: as with any real estate statistics, we do our best to provide the best representation at the time the data was acquired.  We deem the data and reports reliable but not guaranteed.
Tuesday, December 8, 2015

Battle Ground WA Real Estate Market Report October 2015

Seasonal Slowdown has Commenced for Real Estate in Battle Ground in October 2015!

Located just north of Vancouver we have  Battle Ground WA Home Sales turning in very good results in 2015; although it is now showing signs of the typical slowing at this time of the year. These are some of the key points for October 2015:
  • The 3-Month Moving Average for Average Sales-Price has made an atypical turn upwards, and for the year is up 6.76% from the previous year; while the 12-Month Moving Average meandered and is now only 2.17% higher than at the same time in 2014.
     
  • The Inventory level for Resale Homes declined again and is at 1.8 Months (2.7 in May '15) - Clearly a "Seller's Market"
     
  • Approximately 53 Resale Homes closed in October 2015, compared to 58 Sold in October 2014; a decrease of 5 homes or, -8.6%.
     
  • REO/Bank Owned property sales were 2 units (3.8% of total); compared to 5 (8.6%) in October 2014. 
     
  • Short Sale /Pre-Foreclosure property sales were 1 unit (1.9% of total); compared to 3 (5.2%) in 2014.
Battle Ground is a smaller but growing market area in Clark County WA, and growing so much that the available inventory keeps shrinking each month!  As with smaller markets, the charts we prepare and discuss will likely possess greater variability or, show trends that aren't as smooth as a larger market, such as Vancouver WA.  Never the less, the evidence of short term and longer term trends will be clearly evident in our charts below.

This first chart is showing the number of Homes/Units Sold (Excludes New Construction), with the short term trend line (in Red) calculating the 3-Month Moving Average; and the long term trend line (Blue line) showing the 12-month Moving Average.

Battle Ground Resale Home Sales October 2015 - Units Sold Battle Ground Resale Home Sales - Units Sold Trend October 2015

Battle Ground is performing similar to Clark County this year with a moderately strong increase for Unit-Sales volume, as the above chart clearly shows. Slightly different this month however, is that the sales volume is showing a slight upward tick, as we know home buyers are still very much active in this popular market area.

Curiously, the "Slope" of the trend line for Long Average Home Prices (chart below) had become much more "horizontal" or flatter; yet at this generally slower time of the year the price indicators are moving upward.  We see this as another confirmation that Battle Ground's popularity is as strong, if not stronger than ever.. 

Battle Ground Resale Home Sales 2014 - Average Sales Price Trends Battle Ground Resale Home Sales - Avg Sales Price Trend October 2015

The additional charts provided below are from RMLS for Battle Ground WA:


Charts of Battle Ground WA Resale Home Sales Trends in October 2015 Battle Ground Resale Home Sales Inventory & Days on Market Oct. 2015
With October's mini-surge in home sales, some interesting items to point out appear in the above graphs.  Thu unit-sales chart shows that the month of October closed more transactions than July or May!

The second chart shows that the Average transaction price exceeded the average price for new listings coming onto the market.  However, for this item the closed sales are still less than the prior month's average listing price.

Finally, the apparently dramatic increase in the Average Days on Market, and the Median Days on Market likely indicate that with such a shortage of inventory, even the "over-priced" listings are seeing action!

Thank you for reviewing this Battle Ground market report, and please send us any questions you may have!

PS - You are invited to visit the homes in Battle Ground WA page, where we have property listings from the entire RMLS.  Battle Ground WA homes are very popular in 2015.  Don't delay with your Home Selling or Buying Plans - Call Us Today!

A few of the popular Battle Ground WA Home Search Pages on our site include: Battle Ground WA Lots and Land for sale Homes on Acreage in Battle Ground WA; Luxury Homes in Battle Ground WA; One Level Ranch Homes in Battle Ground WA ; Condos for sale in Battle Ground WA

PPS - You may also want to check out additional great nearby communities such as: homes for sale in Hockinson WA; homes for sale in Ridgefield WA; homes for sale in La Center WA homes for sale in Vancouver WA.

The Battle Ground Washington Real Estate charts in this report (prepared by Realtor® John Slocum, our resident statistician) are based on home sales recorded in the Battle Ground  MLS system (RMLS), excluding sales of mobile home; and shows the purchase activity since 2009; charting the 3 month Moving average number of sales, and the 12 month Moving average.  This "smoothing" of the trend-data helps illustrate the short-term and longer term trends in the Battle Ground WA real estate market.

Disclaimer: as with any real estate statistics, we do our best to provide the best representation at the time the data was acquired.  We deem the data and reports reliable but not guaranteed.

Tuesday, December 1, 2015

Vancouver WA Condo Market Report October 2015

Vancouver WA Condo Market with Brisk Sales in October 2015!


 Condos and Townhomes for sale in Vancouver WA (aka Apartments-to-Own) are now facing an extreme shortage of available units to view!  Here are the highlights for October 2015:
  • Condo Average Sales Prices are moving in a seasonal downward direction, with the 3-Month Moving Average now at $192,696 closing down 4.35% over the prior October; and the 12-Month Moving Average closed up 5.72% from the prior year;
       
  • 51 Resale Condos were sold in October, which is about 7 (-12.1%) Fewer condos than in October 2014;
     
  • REO/Bank Owned Condo sales were 1 units (2.0% of total); down from 2 (3.4% of total) in October 2014.
     
  • Short Sale /Pre-Foreclosure property sales were 0 unit (0.0% of total); compared to 3 (5.2% of total) in October 2014.
Attached-Homes + Condos have performed a bit more strongly than Vancouver WA (SFR Homes so far in 2015.  In fact, the available supply of Condos readily available to sell has slipped again to 1.4 months; and for October the Average Days on Market was less than 20; with the Median Days at about 10!

Please continue with the Custom Condo Charts shown below for more of the story! 
Vancouver Washington Condo Sales September 2015 - Units Sold Vancouver WA Resale Condo Sales - Units Sold Trend September 2015
We continue to see the relatively steep decline in the short term trend-line for units-sold, while the long term trend-line's slope is now only a moderate rise - especially when compared to the steeper rise during 2014.  We believe one plausible explanation for the moderating increase in unit-sales is this segment of the Vancouver real estate market has fully recovered; and there are now only so many pre-owned condos that are going to be available for sale.

Average Condo Sales-Prices for this month are trending downwards, which may in large part be due to fewer of the Luxury Condos selling this year when compared to last year.  Again, the Vancouver market for this type of home is relatively small such that greater variability should be expected in the results for this segment.  Thus, the reality for most price-segments is that prices are still firm to increasing.
Vancouver WA Condo Sales September 2015 - Average Sales Price Trends Vancouver WA Resale Condo Sales - Average Sales Price Trend

The RMLS chats below show the most recent twelve (12) months of condo market action - through October 2015, for Unit Sales, Average & Median Prices; and Days on Market:
Charts of Vancouver WA Condo Sales Trends in September 2015 Vancouver Condo Sales Inventory & Days on Market Trends

October's results are shown in different elements with these final three charts. We have now had six (6) months with the Median Days on Market at the sub-20 mark. This month's results are astonishing however, with the Average Days on the Market hitting 20!

We hope you found this report on the Vancouver WA Condo Market to be helpful in your process to sell or buy in this market time.  Please contact us with any questions or comments; and to let us know how we can be of assistance!

PS - Please visit the Condominiums For Sale in Vancouver WA page at our website, where we have made it Easy to search by Neighborhood for Condos, with listings for condos from the entire RMLS.  You do not have to Sign-up to view Condominiums and Townhomes!

PPS - Don't wait any longer with your Condo Selling or Buying Plans - Call Us Soon!


The statistical charts for Vancouver WA Condos in this report (prepared by Vancouver WA Condo Realtor® John Slocum, our resident statistician) are based on condo sales recorded in the Vancouver MLS system (RMLS), excluding sales of newly constructed condos; and shows the purchase activity since 2009; charting the 3 month Moving average number of sales, and the 12 month Moving average.  The "smoothing" of the relatively sparse-data helps to better illustrate the short-term and longer term trends in Vancouver's Condominium market.

Disclaimer: as with all real estate statistics, we do our best to provide the best representation at the time the data was acquired.  We deem the data and reports reliable but not guaranteed.