Saturday, June 27, 2015

Visiting the Recycled Arts Festival in Vancouver WA 2015

Taking in the Recycled Arts Festival in Downtown Vancouver WA June 2015!

Today's weather (June 27, 2015) is expected to hit 97 degrees, which is a bit on the blistering hot side for us however, very high-level clouds in the morning kept the heat away long enough for us to visit the #RAFClarkWA - Recycled Arts Festival in Esther Short Park, in downtown Vancouver.

It is without question that much the "discarded" materials of our modern world or in some cases, from the recent past, can be turned into art or usable items.  The #RAFClarkWA participants used a broad spectrum of recycled elements, from Metal, Glass, and Wood to Fabrics and Plastic.

Here are just a small sampling of what you see if you visit yourself:
Clever and Imaaginative Creature at the Recycled Arts Festival 2015 Imaginative Metal Creature - #RAFClarkWA - June 2015

This quirky metal fisherman is casting his line out, trying to snag a buyer to take them home!

Cycling Gears and Colorful Glass at the Recycled Arts Festival 2015 Colorful Glass and Cycling Gears - #RAFClarkWA - June 2015

This is quite the combination of Bicycle parts - mostly gears, and colorful glass!

Impressive Driftwood Man at the Recycled Arts Festival 2015 Tall and Impressive Driftwood Man - #RAFClarkWA - June 2015

I always love going to the beach and seeing the driftwood, and sometimes taking home unique pieces.  This person has carried that interest into their art with some amazing results, such as this tall Driftwood Man, and the Heart next to it!

Vendors next to Heritage Place Condos at the Recycled Arts Festival 2015 Vendors next to Heritage Place Condos - #RAFClarkWA - June 2015

This year they had so many vendors (about 115 we were told) that 8th St was blocked between Columbia and Esther, next to the Heritage Place Condos.

Bandstand with Live Music at the Recycled Arts Festival 2015 Bandstand with Live Music - #RAFClarkWA - June 2015

Of course with a permanent Bandstand at the park, the appropriate filler is a real band with Live Music!

The Festival continues through to 6:00 pm on the 27th, and !0;00 to 4:00 pm on June 28th, 2015.  They have several misting stations and fans but, you'll still want to bring lots of fresh water as the temperature may hit or exceed 100 degrees! (Revision 6/28 am - the weatherman is now predicting a high of 88 degrees with a chance of thunderstorms!)

PS - The Downtown Vancouver WA area is a favorite of ours for serving our real estate customers whether you want Condos in Downtown Vancouver WA; Homes in Downtown Vancouver WA or, Commercial Property in Vancouver WA - we've got you covered!


The photos and narrative were prepared by Vancouver WA Real Estate Broker John Slocum, on June 27, 2015, all rights reserved.

Friday, June 19, 2015

Luxury Home Market Report For Vancouver WA May 2015

Surging Sales Results for Vancouver's Luxury Home Market in 2015!

Luxury Homes in Vancouver WA

 Vancouver Washington Luxury Homes had taken a substantial hit during the market crash but have been making a nice comeback the past couple of years. So far in 2015 the unit-volume has been substantially better than in prior periods.  Here's the current view:

  • Average Sales Prices are lingering in the area just under $1,000,000.showing the logical greater activity in the $700,000 and slightly above price area.
       
  • 17 Vancouver Luxury Homes were sold through May 2015; compared to 11 in the same period in 2014;
     
  • REO/Bank Owned Luxury Home sales were 0 units; down from 1 in 2014.
     
  • Short Sale /Pre-Foreclosure property sales were 0 - no change from last year.

With the incredible surge in sales of homes in Vancouver WA, especially in the lower price-tiers; there has most certainly been benefit to the Luxury Home tier with "Move Up" buyers now able to actually make such a purchase.  We are also seeing renewed interest form Oregon and California buyers that also want the benefit of No Personal Income Tax here in Washington - combined with the relatively lower cost of a true luxury home!.

Next in line will be our custom charts for Vancouver Luxury Homes: 

Vancouver Washington Luxury Home Sales May 2015 - Units Sold Vancouver WA Luxury Home Sales - Units Sold Trend


The Vancouver WA Luxury Home market is a sub-element of the overall real estate market  thus, the trend line will look unique owing to the relatively smaller statistical-population of units sold each month.  This market segment has lagged the general market by about a year; with a clear upward move starting in early 2013 with the 12 month trend-line (in blue) going from an average of one (1) sale per month to four (4) per month!

Continuing on (below),  the results for Average Luxury Home Sales-Prices are more difficult to illustrate, since the data is not starting at a true zero; and more luxury homes are "graduating up" from the sub-$700,000 cut-off for this report as the market prices rise.

Vancouver WA Luxury Homes and Real Estate Sales May 2015 - Average Sales Price Trends Vancouver WA Luxury Home Sales - Average Sales Price Trend


The set of RMLS chats below show the month-by-month action January 2010 - through May 2015, for Listings & Unit Sales, Average & Median Prices; and Days on Market:

Charts of Vancouver WA Luxury Real Estate and Home Sales Trends in May 2015 Vancouver Luxury Home Sales Inventory & Days on Market Trends


The Inventory by Month graphic helps illustrate how sparse the sales were for the first half of this 5+ year period in this price-tier; with the more recent years seeing much greater activity. 

The Days on Market chart is another way to show the improved health of this price tier.  The first half of the time period had some very "long in the tooth" listings finally sell; while the more recent years the Average time on the market is more reasonable.

List of Vancouver WA Luxury Real Estate and Home Sold 2015 YTD Vancouver Luxury Homes Sold Year-to-Date


When working on this report it became clear that providing some of the basic information on each of the properties sold so far this year may be of benefit to our readers.  As you can see (you can view the larger image on a separate tab/window) there is a great variety of homes sold in neighborhoods ranging from the Columbia River Waterfront / Rivershore Drive area, to the luxury homes in the Felida & Lake Shore area to the Northwest part of Vancouver. 


Note - The RE/MAX Collection qualifications for the Vancouver area has until recently been about $500,000 and above.  With the great rise in average market prices we've chosen a cut-off of $700,000 for this report to ensure we are showing you Luxury Properties.
 
PS
- You are invited to visit our Real Estate in Vancouver WA website, where we have made it Easy to search by Neighborhood for luxury homes and property from the entire RMLS.  You do not have to Sign-up to view luxury homes!

PPS - Don't wait any longer with your Home Selling or Buying Plans - Call Us Soon!


The statistical charts for Vancouver WA Luxury Homes in this report (prepared by Vancouver WA Realtor® John Slocum, our statistician & Econ/Math major) are based on luxury real estate sales recorded in the Vancouver MLS system (RMLS), charting the 3 month Moving average number of sales, and the 12 month Moving average.  The "smoothing" of the relatively sparse-data helps to better illustrate the short-term and longer term trends in Vancouver's Luxury Property market.

Disclaimer: as with all real estate and property statistics, we do our very best to provide the most informative representation at the time the data was acquired.  We deem the data and reports reliable but not guaranteed.

Wednesday, June 17, 2015

Condo Real Estate Market Report Vancouver WA May 2015

Strong Sales Results for Vancouver's Condo Market in May 2015!

Waterfront Condos at Tidewater Cove in Vancouver WA

 Vancouver Washington Condos (aka Apartments-to-Own) have turned in another outstanding month for both Unit-Sales-Volume, and Average Sales Price.  Here are the highlights for May 2015:

  • Condo Average Sales Prices are on the move up, with the 3-Month Moving Average now at $196,015 closing up 14.8% over the prior May; and the 12-Month Moving Average closed up 23.9% - this on top of substantial gains in 2014!
       
  • 59 Resale Condos were sold in May, which is about 7 (13.5%) more condos than in May 2014;
     
  • REO/Bank Owned Condo sales were 5 units (8.5% of total); down from 11 (21.2% of total) in May 2014.
     
  • Short Sale /Pre-Foreclosure property sales were 1 unit (1.7% of total); compared to 1 (1.9% of total) in May 2014.

On a combined basis the Distressed-property segment for Condos at just over 10% is very close with the rest of the Vancouver market, and a welcome relief of the levels seen just a few years ago.

Now for the Custom Charts for Vancouver Condos! 

Vancouver Washington Condo Sales May 2015 - Units Sold Vancouver WA Resale Condo Sales - Units Sold Trend May 2015


The Vancouver WA Condo market is a sub-component of the overall real estate market in Vancouver  thus, the trend line will look unique owing to the relatively smaller population of units sold each month.  The 12 month trend-line is still showing a Strong Up-Trend in Unit-Sales!!!

Continuing on (below),  the results for Average Condo Sales-Prices, with the 3-month moving average line (in red) moved downward substantially during the most-recent Fall and Winter Quarters; and is now strongly upward again. However, the 12-month line (in blue) has also turned sharply with an upward price-change trend.  This comes as no surprise as a major trend is developing in favor of Condos, Patio-homes - all with less upkeep and size.

Vancouver WA Condo Sales May 2015 - Average Sales Price Trends Vancouver WA Resale Condo Sales - Average Sales Price Trend


The set of RMLS chats below show the month-by-month action - through May 2015, for Unit Sales, Average & Median Prices; and Days on Market:

Charts of Vancouver WA Condo Sales Trends in May 2015 Vancouver Condo Sales Inventory & Days on Market Trends


These last charts further highlight May's strong performance, especially with the Median Days on Market now below 20!  RMLS is showing the Inventory level for Vancouver Condos at 1.9 months (1.5 last month) - which is and improvement but still an extreme Seller's Market level. 

We appreciate you took the time to learn more about the Condo Market in the Vancouver Washington market area.  Please feel free to contact us with any questions or comments; and to let us know your selling or buying plans!


PS - You are invited visit the Condos For Sale in Vancouver WA page at our website, where we have made it Easy to search by Neighborhood for Condos, with listings for condos from the entire RMLS.  You do not have to Sign-up to view Condos!

PPS - Don't wait any longer with your Condo Selling or Buying Plans - Call Us Soon!


The statistical charts for Vancouver WA Condos in this report (prepared by Vancouver WA Realtor® John Slocum, our resident statistician) are based on condo sales recorded in the Vancouver MLS system (RMLS), excluding sales of newly constructed condos; and shows the purchase activity since 2009; charting the 3 month Moving average number of sales, and the 12 month Moving average.  The "smoothing" of the relatively sparse-data helps to better illustrate the short-term and longer term trends in Vancouver's Condo market.

Disclaimer: as with all real estate statistics, we do our best to provide the best representation at the time the data was acquired.  We deem the data and reports reliable but not guaranteed.

Tuesday, June 9, 2015

Real Estate Market in Vancouver WA is Hot for May 2015

Real Estate Going Strong in May 2015 for Vancouver WA !

The 2015 Real Estate Rally is still Going Strong in May, with unit-volume at summertime levels, and Median Days On Market still less than 20 days!  Here are the highlight for Mays:
  • Approximately 387 Resale Homes were sold in May 2015, which is about 44 (12.8%) more homes than had sold in May 2014.
     
  • The Price Trend Lines are both very strong, with the 3-Month Moving Average up 7.12% at $257,073; and the 12-Month Moving Average strongly up 11.2%, and now at $252,028.
      
  • Short Sale /Pre-Foreclosure property sales were 22 units (5.7% of total); up slightly from last month; but, still trending down when compared to 28 (8.1% of total) in May of 2014.
  • REO/Bank Owned home sales were 31 units (8.0% of total); and continuing the downward trend when compared to 40 (11.6% of total) in May of 2014.
     
  • Inventory for Resale Homes at the end of May was at 1.8 Months! - no change from last month!
We'll now take a look at the important Vancouver WA Real Estate Market Charts! 

The Quantity (Unit-Sales) of Resale Homes sold in April (Excludes New Construction) are the first to be shown.  We use the simple method of statistical smoothing to show the short term trend line -- the 3-month Moving Average; and the longer term trend line -- the 12-month Moving Average. 
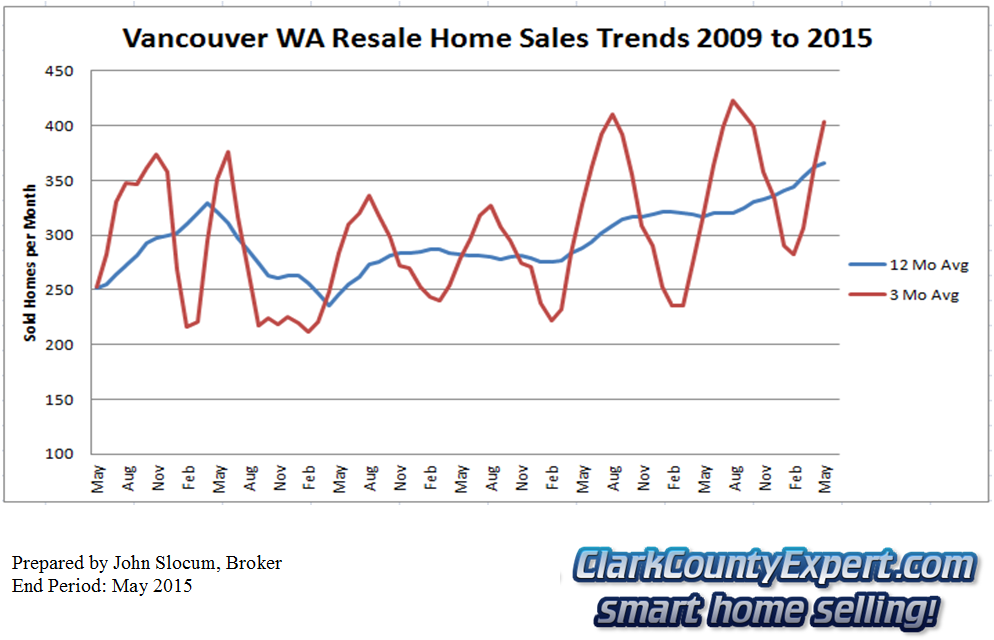
Vancouver Washington Resale Home Sales May 2015 - Units Sold Vancouver WA Resale Home Sales - Units Sold Trend May 2015
Vancouver WA, is the largest city in Southwest Washington; and is also a major sub-component of the greater Portland Oregon Metro area.  With home sales even stronger in Portland, it is easy to see why our local market may have received an extra boost this year!

Vancouver's Resale Home Prices for May 2015 are increasing their upward trend, as the chart below shows.
Vancouver WA Resale Home Sales May 2015 - Average Sales Price Trends Vancouver WA Resale Home Sales - Average Sales Price Trend
89 properties (23%) were priced $200,000 or less when sold; with 117 (30%) sold that were priced $200,000 to $250,000.  With the rapid rise in sales-price, there are fewer and fewer choices in the sub-$200,000 range.   

These chats below are from RMLS showing the most recent twelve-month's of action for Unit Sales, Average & Median Prices; and Days on Market:
RMLS Charts of Vancouver WA Resale Home Sales Trends in May 2015 Vancouver Resale Home Sales Inventory & Days on Market Trends

Median Days on Market went a second month in the sub-20 Days range, confirming that this is a Hot Real Estate Market!


PS - You are invited to visit our Vancouver WA Homes For Sale page.  We've made it is Easy to search by Neighborhood or by Category, with Homes  and real estate listings from the entire RMLS.  Sign-up Not Required!

PPS -2015 is on fire for the Vancouver Washington real estate market.  Do You Have Home Selling or Buying Plans this year? - Call Us Right Away!


The custom charts in this report (prepared by John Slocum Realtor®, our resident statistician) are based on home sales posted in the Vancouver MLS system (RMLS), excluding sales of mobile home; and shows the purchase activity since 2009; charting the 3 month Moving average number of sales, and the 12 month Moving average.  This "smoothing" of the trend-data helps illustrate the short-term and longer term trends in Vancouver WA's real estate market.

Disclaimer: as with any real estate statistics, we do our best to provide the best representation at the time the data was acquired.  We deem the data and reports reliable but not guaranteed.