Showing posts with label clark county wa realtor. Show all posts

Friday, January 14, 2022

Clark County WA Real Estate Sales - November 2021 Report

A "Pause" in the Rising Real Estate Price; with Unit Sales Strong but perhaps a "Leveling" for Clark County WA in November 2021.

This month we are in the third month of prices below, although only slightly, from the all-time High. The number of Units-Sold per-month has peaked for the year, although about 15% more have closed so far this year. Here are the highlights for this month:  

  • Average-Sales Price moved up by less than $1k+ finishing up at $546,659; with the 12-month/long-term trend line up 18.75% year-over-year;  and the 3-Month Moving Average up 16.77% from this time last year; 
     
  • The Inventory for Resale Property is now well below one-month's worth, at the record-low 0.3 Month's worth of Supply;
     
  • Approximately 534 Resale Properties were sold/closed, which is about 73 more (15.84%) properties than in 2020; and 127 fewer than last month;
     
  • REO/Bank Owned property sales were 3 units (0.39% of total); no change from 3 (0.449%) in 2020; 
     
  • Short Sale /Pre-Foreclosure property sales were 0 units (0% of total); no change from 0 (0%) last year.

The Freddie Mac's report on the 30-year-fixed mortgage loan interest rate (nationwide average) at month-end, remained the same ending at a monthly average of 3.07% ; compared to 2.77% for November 2020. Even though the rates have risen off their Low, they are still in historically very low levels.

My Custom Chart (below) has been prepared to show Property-Sales Unit-Volume (number of properties sold) with short term (in Red) and long term (12-month moving average in Blue) trends: 

Clark County Home Sales November 2021- Units Sold Clark County Real Estate - Units Sold Trend November 2021

The short-term trend is now in its seasonal decline, when compared to last year when it was peaking at this month. The long-term trend-line is continuing its plateau phase. So far this year the County is ahead of last years total home sales by over 992 properties (+15.49%).

Next up we have a chart showing the Average Real Estate Sales Price, the short-term measure taking a "pause"; with the long-term trend continuing up to a new high: 

Clark County Home Sales November 2021- Average Sales Price Trends Clark County Real Estate Sales - Average Sales Price Trend November 2021

We've had a relatively strong showing this year for rising prices, and we are finally seeing "resistance" of some form or fashion in this measurement. With such a low level of Supply, and continued low interest rates we currently don't expect prices to be too "soft" in the near term.
 
Clark County's Average Residential Property Sales Price (using the most recent 3 months) is now $546,659; which is approximately $78,207 (+16.69%) higher than this time last year.

These remaining charts for this real estate sales report come from RMLS and show:
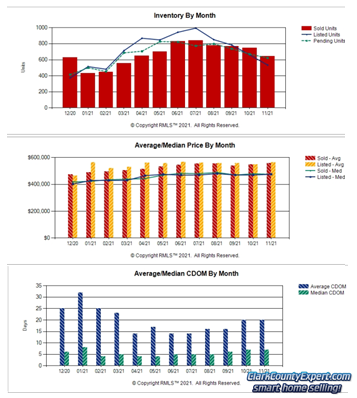
Charts of Vancouver WA Home Sales Trends in November 2021 Clark County Real Estate Sales Inventory
& Days on Market - November 2021


New Listings, Pending Sales and Closed Sales all eased this month; with Pending sales coming in higher than New Listings. This helped cause Active Inventory to slide and is at 0.3 month's of supply. 

The second graph shows the Average Price for Closed Sales at a new high; and the Average Listing Price coming in strong but still below its recent high.

Finally, the Average Days on Market increased remained at 20 days; and Median Days on Market remained at 7 days. This is showing we still have a brisk market for this typically slower time of year.  

Thank you for viewing our Real Estate Market Report for Clark County WA. Please let me know if you have any questions or need help with your home or condo sale or purchase!


PS - The real estate market is changing, prices are still rising, with loan costs presently at NEAR-RECORD low levels, keeping this an excellent time to List and Sell Your Property with Our Team; or, at least find out what your property is worth!  We offer a no-cost, no-obligation Clark County WA Property Valuation, and invite you to try it out!

PPS - Looking to buy a property reasonably soon?  Interest rates are still at historically low rates.  You are invited to visit our web-page for Clark County WA Real Estate For Sale where it is Quite Easy to search by City, Neighborhood or by Category, with homes and real estate listings from the entire RMLS.  Sign-up Not Required!  The property and home listings shown are provided via many updates each day, and you will be e-mailed hourly with any new matches once you've signed up for a home search.

We also have the MLS Listings for these great towns in Clark County:  Battle Ground WA Real Estate For Sale | Brush Prairie WA Homes For Sale | Camas WA Homes for Sale | Hockinson WA Homes For Sale | La Center WA Homes for sale | Ridgefield WA Homes for sale | Real Estate for sale in Vancouver Washington | Washougal WA Real Estate | Yacolt WA Homes For Sale | Amboy WA Homes For Sale


The information and charts in this Clark County WA real estate update (prepared by Clark County WA Real Estate Sales Realtor, John Slocum, SFR, our resident statistician) are based on home sales recorded in the Clark County WA MLS system (RMLS), excluding sales of mobile home; and shows the purchase activity since 2009; charting the 3 month Moving average number of sales, and the 12 month Moving average.  This "smoothing" of the trend-data helps illustrate the short-term and longer term trends in Clark County's real estate market.

Disclaimer: as with any real estate statistics, we do our best to provide the best representation at the time the data was acquired and compiled.  The data and reports are deemed reliable but not guaranteed.

Tuesday, September 21, 2021

Clark County WA Real Estate For Sale - August 2021 Report

A Slight Slowing Seen in the Real Estate Price Rise; with Unit Sales remaining Strong for Clark County WA in August 2021.

This month we finally see slowing in the rising prices for the County - although the resultant level is still 20%+ higher than last year. We've also seen the typical slowing in the number of units-sold but again, the number is 100 units higher than the same month last year. Here are the highlights for this month:  

  • Average-Sales Price moved up by about $7k+ finishing up at $550,668; with the 12-month/long-term trend line up 19.009% year-over-year;  and the 3-Month Moving Average up 20.6% from this time last year; 
     
  • The Inventory for Resale Property is still below one-month's worth, at the super-low 0.7 Month's worth of Supply;
     
  • Approximately 768 Resale Properties were sold/closed, which is about 100 more (14.75%) properties than in 2020; and 71 fewer than last month;
     
  • REO/Bank Owned property sales were 3 units (0.39% of total); no change from 3 (0.449%) in 2020; 
     
  • Short Sale /Pre-Foreclosure property sales were 0 units (0% of total); no change from 0 (0%) last year.

The Freddie Mac's report on the 30-year-fixed mortgage loan interest rate (nationwide average) at month-end, moved down slightly ending at a monthly average of 2.84% ; compared to 2.94% for August 2020. The Federal Reserve is still in the mode of keeping this benchmark rate low, and pumping funds into the markets.

Custom Charts (below)I have prepared show Property-Sales Unit-Volume (number of properties sold) with short term (in Red) and long term (12-month moving average in Blue) trends: 

Clark County Home Sales August 2021- Units Sold Clark County Real Estate - Units Sold Trend August 2021

The short-term trend is now rising less steeply and may be near this year's high. The long-term trend-line is showing a slowing phase also. So far this year the County is ahead of last years total home sales by over 1,051 properties (+25%).

Next up are my charts showing the Average Real Estate Sales Price, the short-term measure hitting another record; with the long-term trend also at a new high: 

Clark County Home Sales August 2021- Average Sales Price Trends Clark County Real Estate Sales - Average Sales Price Trend August 2021

With such a large increase in properties purchased so far this year, it is perhaps little wonder that the available Active Inventory at any one time is very slim. Once again we have finished the month with less than one month's worth of available supply.
 
Clark County's Average Residential Property Sales Price (using the most recent 3 months) is now $550,668; which is approximately $94,062 (+20.60%) higher than this time last year.

These remaining charts for this real estate sales report come from RMLS and show:

Charts of Vancouver WA Home Sales Trends in August 2021 Clark County Real Estate Sales Inventory
& Days on Market - August 2021


Both New Listings and Closed Sales eased this month; with Pending sales gaining slightly. Active Inventory at 0.7 month's of supply remains stubbornly below one-month's worth of supply. 

The second graph shows the Average Price for Closed Sales a few hundred dollars below its high; and the Average Listing Price coming in a few thousand dollars below its recent high.

Finally, the Average Days on Market increased by just 2 days; and Median Days on Market remained at 5 days. This is the 7th month in a row that the Median has been at 5 or fewer days.  

Thank you for viewing our Real Estate Market Report for Clark County WA. Please let me know if you have any questions or need help with your home or condo sale or purchase!


PS - The real estate market is changing, prices are still rising, with loan costs presently at NEAR-RECORD low levels, keeping this an excellent time to List and Sell Your Property with Our Team; or, at least find out what your property is worth!  We offer a no-cost, no-obligation Clark County WA Property Valuation, and invite you to try it out!

PPS - Looking to buy a property reasonably soon?  Interest rates are still at historically low rates.  You are invited to visit our web-page for Clark County WA Real Estate For Sale where it is Quite Easy to search by City, Neighborhood or by Category, with homes and real estate listings from the entire RMLS.  Sign-up Not Required!  The property and home listings shown are provided via many updates each day, and you will be e-mailed hourly with any new matches once you've signed up for a home search.

We also have the MLS Listings for these great towns in Clark County:  Battle Ground WA Real Estate For Sale | Brush Prairie WA Homes For Sale | Camas WA Homes for Sale | Hockinson WA Homes For Sale | La Center WA Homes for sale | Ridgefield WA Homes for sale | Real Estate for sale in Vancouver Washington | Washougal WA Real Estate | Yacolt WA Homes For Sale | Amboy WA Homes For Sale


The information and charts in this Clark County WA real estate update (prepared by Clark County WA Real Estate Sales Realtor, John Slocum, SFR, our resident statistician) are based on home sales recorded in the Clark County WA MLS system (RMLS), excluding sales of mobile home; and shows the purchase activity since 2009; charting the 3 month Moving average number of sales, and the 12 month Moving average.  This "smoothing" of the trend-data helps illustrate the short-term and longer term trends in Clark County's real estate market.

Disclaimer: as with any real estate statistics, we do our best to provide the best representation at the time the data was acquired and compiled.  The data and reports are deemed reliable but not guaranteed.

Wednesday, July 14, 2021

Clark County WA Real Estate - June 2021 Report

Rocketing Real Estate Prices and Unit Sales for Clark County WA in June 2021.

Prices have risen so fast and so far that their level is over $100,000 higher than this time last year! Unit Sales now exceed last year's mark by 31%. Needless to say, Active Inventory still remains super-low while this over-heated, bubbling market moves on. Here are the highlights for this month:  

  • Average-Sales Price moved up by about $14k+ finishing up at $531,148; with the 12-month/long-term trend line up 18.44% year-over-year;  and the 3-Month Moving Average up 24.19% from this time last year; 
     
  • The Inventory for Resale Property remained at the super-low 0.6 Month's worth of Supply;
     
  • Approximately 942 Resale Properties were sold/closed, which is about 220 more (30.5%) properties than in 2020; and 94 more than last month;
     
  • REO/Bank Owned property sales were 0 unit (0% of total); down from 3 (0.42%) in 2020; 
     
  • Short Sale /Pre-Foreclosure property sales were 0 units (0% of total); down from  (0.28%) last year.

The Freddie Mac's report on the 30-year-fixed mortgage loan interest rate (nationwide average) at month-end, remained almost unchanged ending at a monthly average of 2.98% ; compared to 3.16% for June 2020. We are hearing the Federal Reserve is still in the mode of keeping this benchmark rate low.

I have prepared a custom chart showing Property-Sales Unit-Volume (number of properties sold) with short term (in Red) and long term (12-month moving average in Blue) trends: 

Clark County Home Sales June 2021- Units Sold Clark County Real Estate - Units Sold Trend June 2021

We see the short-term trend rising quite steeply and is very near last year's high. The long-term trend-line continues to rise at its steepest rate in decades. So far this year the County is ahead of last years total home sales by over 855 properties (+31%).

Continuing on to the Average Real Estate Sales Price, the short-term measure is still rising steeply and in record territory; with the long-term trend also powering to a new high: 

Clark County Home Sales June 2021- Average Sales Price Trends Clark County Real Estate Sales - Average Sales Price Trend June 2021

The persistent extremely low level of Active Inventory has extended the imbalance between Buyers and available properties to purchase, with the strong rapid rise in prices to be inevitable.
 
Clark County's Average Residential Property Sales Price (using the most recent 3 months) is now $531,148; which is approximately $103,447 (+24.19%) higher than this time last year.

These final charts for this real estate sales report come from RMLS and show:

Charts of Vancouver WA Home Sales Trends in June 2021 Clark County Real Estate Sales Inventory
& Days on Market - June 2021


Both New Listings and Closed Sales had strong gains; with Pending sales gaining a small amount. Active Inventory at 0.6 month's of supply remains near the record-low, a clear sign of an un-balanced market. 

The second graph shows both the Average Price for Closed Sales and Average Listing Price coming in at new high-marks.

Finally, both the Average Days on Market and Median Days on Market are at their low for the past 12 months.  

Thank you for visiting our Real Estate Market Report for Clark County Washington. Please let me know if you have any questions or need help with your home or condo sale or purchase!


PS - The real estate market is changing, prices are still rising, with loan costs presently at NEAR-RECORD low levels, keeping this an excellent time to List and Sell Your Property with Our Team; or, at least find out what your property is worth!  We offer a no-cost, no-obligation Clark County WA Property Valuation, and invite you to try it out!

PPS - Looking to buy a property reasonably soon?  Interest rates are still at historically low rates.  You are invited to visit our web-page for Clark County WA Real Estate For Sale where it is Quite Easy to search by City, Neighborhood or by Category, with homes and real estate listings from the entire RMLS.  Sign-up Not Required!  The property and home listings shown are provided via many updates each day, and you will be e-mailed hourly with any new matches once you've signed up for a home search.

We also have the MLS Listings for these great towns in Clark County:  Battle Ground WA Real Estate For Sale | Brush Prairie WA Homes For Sale | Camas WA Homes for Sale | Hockinson WA Homes For Sale | La Center WA Homes for sale | Ridgefield WA Homes for sale | Real Estate for sale in Vancouver Washington | Washougal WA Real Estate | Yacolt WA Homes For Sale | Amboy WA Homes For Sale


The information and charts in this Clark County WA real estate update (prepared by Clark County WA Real Estate Sales Realtor, John Slocum, SFR, our resident statistician) are based on home sales recorded in the Clark County WA MLS system (RMLS), excluding sales of mobile home; and shows the purchase activity since 2009; charting the 3 month Moving average number of sales, and the 12 month Moving average.  This "smoothing" of the trend-data helps illustrate the short-term and longer term trends in Clark County's real estate market.

Disclaimer: as with any real estate statistics, we do our best to provide the best representation at the time the data was acquired and compiled.  The data and reports are deemed reliable but not guaranteed.

Tuesday, May 25, 2021

Real Estate for sale Clark County WA - April 2021

Real Estate Market On-Fire describes Clark County WA in April 2021.

Unit Sales are coming in at a record high-level at an extremely brisk pace; with Prices continuing to Rise at an extreme rate. New Listings have risen but not enough to move Active Inventory out of its low territory. Here are the highlights for this month:  

  • Average-Sales Price moved up by about $10k finishing up at $506,106 - the first time to finish over the $500k mark!; with the 12-month/long-term trend line up 15.45% year-over-year;  and the 3-Month Moving Average up 20.57% from this time last year; 
     
  • The Inventory for Resale Property moved up slightly to 0.6 Month's worth of Supply;
     
  • Approximately 642 Resale Properties were sold/closed, which is about 207 more (47.6%) properties than in 2020; and 87 more than last month;
     
  • REO/Bank Owned property sales were 1 unit (0.16% of total); down from 5 (1.15%) in 2020; 
     
  • Short Sale /Pre-Foreclosure property sales were 0 units (0% of total); no change from 0 (0%) last year.

The Freddie Mac's report on the 30-year-fixed mortgage loan interest rate (nationwide average) at month-end, dropped slightly to a monthly average of 3.06% ; compared to 3.31% for April 2020. The current trend is seeing this rate staying near 3% for the near term.

Property-Sales Unit-Volume (number of properties sold) with short term (in Red) and long term (12-month moving average in Blue) trends are shown in my custom chart: 

Clark County Home Sales April 2021- Units Sold Clark County Real Estate - Units Sold Trend April 2021

The short-term trend has set a new record for the highest "seasonal low" we've ever posted. The long-term trend-line is blasting well into new high territory for this measure. So far this year the County is well ahead of last years total home sales by over 419 properties (+25%).

This month the Average Real Estate Sales Price continues its rapid rise into ever new record territory; mirrored by the long-term the trend which also hit an all-time high: 

Clark County Home Sales April 2021- Average Sales Price Trends Clark County Real Estate Sales - Average Sales Price Trend April 2021

Mortgage Loan Interest Rates have seemed to pause in their recent upwards movement. However, we are hearing that Inflation is happening on a broader scale in the Economy which we expect will cause mortgage rates to move higher.
 
Clark County's Average Home Sales Price (using the most recent 3 months) is now $506,106; which is approximately $86,348 (+20.57%) higher than this time last year.

The final charts for this real estate sales report come from RMLS and show:

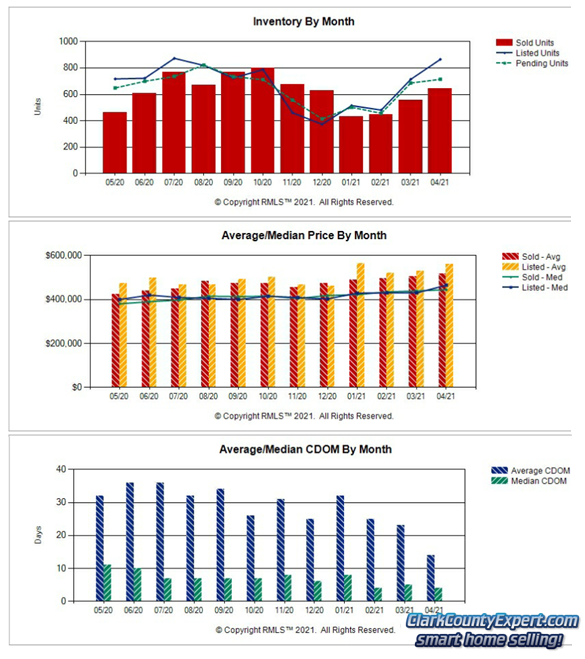
Charts of Vancouver WA Home Sales Trends in April 2021 Clark County Real Estate Sales Inventory
& Days on Market - April 2021


Both New Listings and Closed Sales moved higher; with Pending sales moving up only slightly - when this mark had been closely tracking the New Listing measure (are we seeing some slowing???). Active Inventory at 0.6 month's of supply is extremely low, and making for an unhealthy market. 

The second graph shows the Average Price for Closed Sales hit another New high level for the year. The Average Listing Price came in at its second highest mark.

Finally, the market pace has become quicker, and is the fastest-pace for the year.  

Thank you for viewing my Real Estate Sales Report for Clark County Washington. Please let me know if you have any questions or need help with your home or condo sale or purchase!


PS - The real estate market is changing, prices are still rising, with loan costs presently at NEAR-RECORD low levels, keeping this an excellent time to List and Sell Your Property with Our Team; or, at least find out what your property is worth!  We offer a no-cost, no-obligation Clark County WA Property Valuation, and invite you to try it out!

PPS - Looking to buy a property reasonably soon?  Interest rates are still at historically low rates.  You are invited to visit our web-page for Clark County WA Real Estate For Sale where it is Quite Easy to search by City, Neighborhood or by Category, with homes and real estate listings from the entire RMLS.  Sign-up Not Required!  The property and home listings shown are provided via many updates each day, and you will be e-mailed hourly with any new matches once you've signed up for a home search.

We also have the MLS Listings for these great towns in Clark County:  Battle Ground WA Real Estate For Sale | Brush Prairie WA Homes For Sale | Camas WA Homes for Sale | Hockinson WA Homes For Sale | La Center WA Homes for sale | Ridgefield WA Homes for sale | Real Estate for sale in Vancouver Washington | Washougal WA Real Estate | Yacolt WA Homes For Sale | Amboy WA Homes For Sale


The information and charts in this Clark County WA real estate update (prepared by Clark County WA Real Estate Sales Realtor, John Slocum, SFR, our resident statistician) are based on home sales recorded in the Clark County WA MLS system (RMLS), excluding sales of mobile home; and shows the purchase activity since 2009; charting the 3 month Moving average number of sales, and the 12 month Moving average.  This "smoothing" of the trend-data helps illustrate the short-term and longer term trends in Clark County's real estate market.

Disclaimer: as with any real estate statistics, we do our best to provide the best representation at the time the data was acquired and compiled.  The data and reports are deemed reliable but not guaranteed.

Tuesday, March 16, 2021

Clark County WA Real Estate - February 2021 Report

Robust Real Estate Property-Sales Continue while Sales Prices Resume their Upward Move for Clark County WA in February 2021.

Property sales have been quite brisk for this late-winter month; with sales prices - after a few months of side-ways movement - are rising once again, as the level of active Inventory remains super low! Here are the highlights for this month:  

  • Average-Sales Price moved up by about $14k finishing up at $484,988; with the 12-month/long-term trend line up 13.72% year-over-year;  and the 3-Month Moving Average up 17.59% from this time last year; 
     
  • The Inventory for Resale Property moved up slightly to 0.4 Month's worth of Supply;
     
  • Approximately 434 Resale Properties were sold/closed, which is about 43 more (11%) properties than in 2020; and 3 more than last month;
     
  • REO/Bank Owned property sales were 2 units (0.46% of total); down from 4 (1.02%) in 2020; 
     
  • Short Sale /Pre-Foreclosure property sales were 0 units (0% of total); down from 2 (0.51%) last year.

The Freddie Mac's report on the 30-year-fixed mortgage loan interest rate (nationwide average) at month-end, rose again slightly to a monthly average of 2.81% ; compared to 3.47% for February 2020. The current trend is seeing this rate in a rising pattern now for the near term.

Property-Sales Unit-Volume (number of properties sold) with short term (in Red) and long term (12-month moving average in Blue) trends are shown in my custom chart: 

Clark County Home Sales February 2021- Units Sold Clark County Real Estate - Units Sold Trend February 2021

With unseasonably strong buyer-demand we see the short-term line is at a much higher level than a year ago, although near-term it is declining. Long-term the trend-line continues near its all-time high. So far this year the County is well ahead of last years total home sales by over 100 properties.

This month the Average Real Estate Sales Price broke out of its holding pattern and moved up to a new all-time high. The long-term the trend is still very positive and also hit an all-time high: 

Clark County Home Sales February 2021- Average Sales Price Trends Clark County Real Estate Sales - Average Sales Price Trend February 2021

Mortgage Loan Interest Rates have been edging upwards, although for this month the average remained below 3.0% (as of this writing we are now sneaking above 3.0%). With Inflation becoming more of a concern, the rates for Mortgages and Bonds will see a higher-trending rate.
 
Clark County's Average Home Sales Price (using the most recent 3 months) is now $484,988; which is approximately $72,544 (+17.59%) higher than this time last year.

The final charts for this real estate sales report come from RMLS and show:

Charts of Vancouver WA Home Sales Trends in February 2021 Clark County Real Estate Sales Inventory
& Days on Market - February 2021


Both New Listings and Pending Sales drifted lower; likely because this month is shorter than the others. Closed Sales still came in a few units higher than last month. Active Inventory at 0.4 month's of supply is super-low, which of course is challenging for home buyers to find the property they want before a competing buyer snaps it up. 

The second graph shows the Average Price for Closed Sales at its New highest level for the year. The Average Listing Price came in higher than the closed-sales price, and at its second highest mark.

Finally, the market pace became the fastest for the year; with the Average Days on Market matching one previous month; while the Median Days on the Market fell to the lowest at 4 days - and this is supposed to be a slow-to-medium-paced month! 

Thank you for viewing my Real Estate Sales Report for Clark County Washington. Please let me know if you have any questions or need help with your home or condo sale or purchase!


PS - The real estate market is changing, prices are still rising, with loan costs presently at RECORD low levels, keeping this an excellent time to List and Sell Your Property with Our Team; or, at least find out what your property is worth!  We offer a no-cost, no-obligation Clark County WA Property Valuation, and invite you to try it out!

PPS - Looking to buy a property reasonably soon?  Interest rates are still at historically low rates.  You are invited to visit our web-page for Clark County WA Real Estate For Sale where it is Quite Easy to search by City, Neighborhood or by Category, with homes and real estate listings from the entire RMLS.  Sign-up Not Required!  The property and home listings shown are provided via many updates each day, and you will be e-mailed hourly with any new matches once you've signed up for a home search.

We also have the MLS Listings for these great towns in Clark County:  Battle Ground WA Real Estate For Sale | Brush Prairie WA Homes For Sale | Camas WA Homes for Sale | Hockinson WA Homes For Sale | La Center WA Homes for sale | Ridgefield WA Homes for sale | Real Estate for sale in Vancouver Washington | Washougal WA Real Estate | Yacolt WA Homes For Sale | Amboy WA Homes For Sale


The information and charts in this Clark County WA real estate update (prepared by Clark County WA Real Estate Sales Realtor, John Slocum, SFR, our resident statistician) are based on home sales recorded in the Clark County WA MLS system (RMLS), excluding sales of mobile home; and shows the purchase activity since 2009; charting the 3 month Moving average number of sales, and the 12 month Moving average.  This "smoothing" of the trend-data helps illustrate the short-term and longer term trends in Clark County's real estate market.

Disclaimer: as with any real estate statistics, we do our best to provide the best representation at the time the data was acquired and compiled.  The data and reports are deemed reliable but not guaranteed.

Friday, December 11, 2020

Home Sales Report Clark County WA - November 2020

Super-Strong Monthly Home-Sales Continue While Sales Prices Ease Slightly for Clark County WA in November 2020.

With an insanely low level of active Inventory for resale homes, combined with unusually strong demand late in the season keeps prices high with choices few for home buyers. Here are this month's key points:  

  • Average-Sales Price eased by about $8k finishing up at $468,703; with the 12-month/long-term trend line up 11.67% year-over-year;  and the 3-Month Moving Average up 15.99% from this time last year; 
     
  • The Inventory for Resale Homes is still tanking and finished at 0.6 Month's worth of Supply;
     
  • Approximately 653 Resale Properties were sold/closed, which is about 109 more (20.04%) homes than in 2019; although 141 fewer than last month;
     
  • REO/Bank Owned property sales were 1 units (0.15% of total); down from 5 (0.92%) in 2019; 
     
  • Short Sale /Pre-Foreclosure property sales were 1 units (0.15% of total); no change from 1 (0.18%) last year.

Again the nation's Home Loan Mortgage 30-year-fixed loan interest rate (nationwide average) at month-end, remained below 3% settling at a monthly average of 2.77% (another All-Time Low!) according to Freddie Mac; compared to 3.70% for November 2019. With inflation starting to creep in, it is likely we'll see rates starting to go up - although when that happens is anyone's guess.

Just below I have created a custom chart to show Home-Sales Unit-Volume (number of homes sold) with short term (in Red) and long term (12-month moving average in Blue) trends: 

Clark County Home Sales November 2020- Units Sold Clark County Home Sales - Units Sold Trend November 2020

With incredibly strong late-season home sales this year the short-term line is both at an all-time high, and only slowly "rolling over" to the expected upcoming winter decline in activity. The long-term line continues to move upwards although it is below its peak seen a few years ago. Overall the County is now ahead of last years total home sales by 108 homes (or, 1.72%).

This month the Average Home Sales Prices took a slight pause (declining about $8k) in the near-term; while the long-term trend is still in a positive direction: 

Clark County Home Sales November 2020- Average Sales Price Trends Clark County Home Sales - Average Sales Price Trend November 2020

We are clearly in an uncommon situation with continued stronger-than-usual sales month-over-month. It is reasonable to expect that Prices will continue to have strong support will remain for many more months to come; absent another negative-disruption in the underlying Economy.
 
Clark County's Average Home Sales Price (using the most recent 3 months) is now $468,703; which is approximately $64,603 (+15.99%) higher than this time last year.

The remaining charts for our home sales report come from RMLS and show:

Charts of Vancouver WA Home Sales Trends in November 2020 Clark County Home Sales Inventory
& Days on Market - November 2020


New Listings and Pending Sales are both trending lower, although still remain at a higher overall level than seen in previous years. Closed Sales likewise are "slowing" but are at a much higher level relative to previous seasons. With Inventory at 0.6 month's of supply we are in an extremely strong Seller's Market! 

The second graph shows Prices for Closed Sales and Average Listing Price remaining in very high territory.

Finally, the Average Days on Market rose by about a week; while the Median Days on the Market rose only about one day's worth. Clearly we're still in a very fast-paced housing market.

Thank you for visiting our Home Sales Report for Clark County Washington. Please let me know if you have any questions or need help with your home or condo sale or purchase!


PS - The home sales market is changing, prices are still rising, with loan costs presently at RECORD low levels, keeping this an excellent time to List and Sell Your Home with Our Team; or, at least find out what your property is worth!  We offer a no-cost, no-obligation Clark County WA Home Valuation, and invite you to try it out!

PPS - Looking to buy a home or property reasonably soon?  Interest rates are still at historically low rates.  You are invited to visit our web-page for Clark County WA Homes For Sale where it is Quite Easy to search by City, Neighborhood or by Category, with homes and real estate listings from the entire RMLS.  Sign-up Not Required!  The property and home listings shown are provided via many updates each day, and you will be e-mailed hourly with any new matches once you've signed up for a home search.

We also have the MLS Listings for these great towns in Clark County:  Battle Ground WA Homes For Sale | Brush Prairie WA Homes For Sale | Camas WA Homes for Sale | Hockinson WA Homes For Sale | La Center WA Homes for sale | Ridgefield WA Homes for sale | Homes for sale in Vancouver Washington | Washougal WA Real Estate | Yacolt WA Homes For Sale | Amboy WA Homes For Sale


The information and charts in this Clark County WA real estate update (prepared by Vancouver WA Home Sales Realtor, John Slocum, SFR, our resident statistician) are based on home sales recorded in the Clark County WA MLS system (RMLS), excluding sales of mobile home; and shows the purchase activity since 2009; charting the 3 month Moving average number of sales, and the 12 month Moving average.  This "smoothing" of the trend-data helps illustrate the short-term and longer term trends in Clark County's real estate market.

Disclaimer: as with any real estate statistics, we do our best to provide the best representation at the time the data was acquired and compiled.  The data and reports are deemed reliable but not guaranteed.

Wednesday, September 9, 2020

Real Estate Sales Clark County WA - August 2020 Report

Unit-Sales Ease while Prices Continue to Rocket Upward for Clark County WA in August 2020.

The convergence of Low Active Inventory and Buyer Demand that had been delayed from prior months is squeezing sales prices strongly upwards. Unit Sales eased slightly - most likely because there are fewer listings to choose from! Here are key points for this month:  

  • Average-Sales Price jumped up to $456,571 - an $17k+ month-over-month gain; with the 12-month/long-term trend line up 12.15% year-over-year;  and the 3-Month Moving Average up 7.77% from this time last year; 
     
  • The Inventory for Resale Real Estate slipped 0.2 to finish at 1.0 Month's worth of Supply;
     
  • Approximately 630 Resale Properties were sold/closed, which is about 114 fewer (-15.32%) homes than in 2019; and 132 fewer than last month;
     
  • REO/Bank Owned property sales were 3 units (0.47% of total); down from 5 (0.66%) in 2019; 
     
  • Short Sale /Pre-Foreclosure property sales were 0 units (0% of total); down from 3 (0.39%) last year.

The Home Loan Mortgage 30-year-fixed loan interest rate (nationwide average) at month-end, fell below 3% to a monthly average of 2.94% (another All-Time Low!) according to Freddie Mac; compared to 3.62% for August 2019. It is expected that rates will remain low for the near future.

I have prepared an updated custom chart showing Unit-Volume (number of properties sold) action with short term (in Red) and long term (12-month moving average in Blue) trends shown below: 

Clark County Home Sales August 2020- Units Sold Clark County Home Sales - Units Sold Trend August 2020

With relatively strong Unit-sales we still have an upward move for the short-term line; and even have a slight upwards move for the long-term line. However, we are still 9.22% below last year for year-to-date closed sales.

The next chart shows Average Home Sales Price trend rocketing upwards in the near-term; with the long-term line steepening its slope also: 

Clark County Home Sales August 2020- Average Sales Price Trends Clark County Home Sales - Average Sales Price Trend August 2020

New Listings are not nearly enough to meet the demand by home buyers. We also are seeing the trend nation-wide for people leaving the big cities for suburban counties such as Clark County. That, and with the low interest rates, we expect the price trend to be strongly upwards for the near term.
 
Clark County's Average Home Sales Price (using the most recent 3 months) is now $456,571; which is approximately $49,460 (+12.15%) higher than this time last year.

The remaining graphs for our report come from RMLS and show:

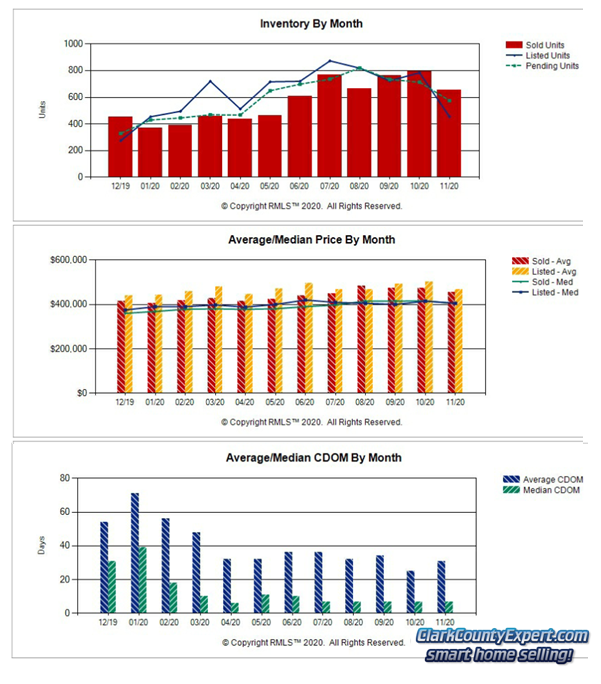
Charts of Vancouver WA Home Sales Trends in August 2020 Clark County Home Sales Inventory
& Days on Market - August 2020


New Listings eased off of last month's high for the year; while Pending Sales came in at their highest level for the year. Closed Sales also eased off but still came in at about the second-highest level for the past twelve months. The combined result was Inventory shrank by 0.2 month's worth of supply. 

The second graph shows Prices for Closed Sales again hitting their highest one-month mark, this time by a wide-margin over last month which was the previous high. Average Listing Price came in quite high as well, although not the highest level ever..

Finally, the Average Days on Market fell by several days; while the Median Days on the Market - already at a low level - remained the same. Both are in the expected Summer season range.

Thank you for visiting our report for real estate Sales in Clark County Washington. Please let me know if you have any questions or need help with your home or condo sale or purchase!


PS - The real estate market is changing, prices are still rising, with loan costs presently at RECORD low levels, keeping this an excellent time to List and Sell Your Property with Our Team; or, at least find out what your property is worth!  We offer a no-cost, no-obligation Clark County WA Property Valuation, and invite you to try it out!

PPS - Looking to buy a home or property reasonably soon?  Interest rates are still at historically low rates.  You are invited to visit our web-page for Clark County WA Real Estate For Sale where it is Quite Easy to search by City, Neighborhood or by Category, with homes and real estate listings from the entire RMLS.  Sign-up Not Required!  The property and home listings shown are provided via many updates each day, and you will be e-mailed hourly with any new matches once you've signed up for a home search.

We also have the MLS Listings for these great towns in Clark County:  Battle Ground WA Real Estate For Sale | Brush Prairie WA Homes For Sale | Camas WA Homes for Sale | Hockinson WA Homes For Sale | La Center WA Homes for sale | Ridgefield WA Homes for sale | Real Estate for sale in Vancouver Washington | Washougal WA Real Estate | Yacolt WA Homes For Sale | Amboy WA Homes For Sale


The information and charts in this Clark County WA real estate update (prepared by Vancouver WA Real Estate Sales Broker, John Slocum, CRS, SFR, our resident statistician) are based on home sales recorded in the Clark County WA MLS system (RMLS), excluding sales of mobile home; and shows the purchase activity since 2009; charting the 3 month Moving average number of sales, and the 12 month Moving average.  This "smoothing" of the trend-data helps illustrate the short-term and longer term trends in Clark County's real estate market.

Disclaimer: as with any real estate statistics, we do our best to provide the best representation at the time the data was acquired and compiled.  The data and reports are deemed reliable but not guaranteed.

Friday, July 17, 2020

Clark County WA Real Estate Sales - June 2020 Report

Closed Unit-Home Sales Still Lagging Year-to-Date With Prices More-Strongly Rising for Clark County WA in June 2020.

Closed sales did pick up this month but lower than last year's posting; and year-to-date numbers are off 13%. Prices increased more rapidly this month, with the super-low Inventory and record-low interest rates. Here are the key points for this month's report: 

  • Average-Sales Price moved up to $427,280 - another all-time high, with the 12-month/long-term trend line up 5.06% year-over-year;  and the 3-Month Moving Average up 7.01% from this time last year; 
     
  • The Inventory for Resale Real Estate remained at a super low 1.1 Month level of Supply;
     
  • Approximately 573 Resale Properties were sold/closed, which is about 87 fewer (-13.18%) homes than in 2019; and 112 more than last month;
     
  • REO/Bank Owned property sales were 3 units (0.52% of total); no change from 3 (0.45%) in 2019; 
     
  • Short Sale /Pre-Foreclosure property sales were 2 unit (0.35% of total); up from 0 (0%) in 2019.

The Home Loan Mortgage 30-year-fixed loan interest rate (nationwide average) at month-end, slipped to 3.16% (another All-Time Low!) according to Freddie Mac; compared to 3.80% for June 2019. We expect rates to stay this low for several more months.

We now come to the custom chart showing Unit-Volume (number of properties sold) action with short term (in Red) and long term (12-month moving average in Blue) trends: 

Clark County Home Sales June 2020- Units Sold Clark County Home Sales - Units Sold Trend June 2020

Unit-sales results this year finds us with the short-term trend below the long-term trend by 50 units; whereas last year the short-term line was above the long-term line by 63 units! Pending sales have picked up but not enough to quickly close the accumulated gap.   

The Average Home Sales Price custom chart is up next showing the current and past Home-Sales-Price results for both short-term and long-term: 

Clark County Home Sales June 2020- Average Sales Price Trends Clark County Home Sales - Average Sales Price Trend June 2020

The rising Price Trend got steeper this month; no doubt a result of lower available new listings and strong-enough pending sales. Without a stronger upward move in newly listed homes and condos the prices will likely keep moving strongly higher.
 
The Average Sales Price (using 3 months) for Clark County is now $427,280; which is approximately $28,005 higher than this time last year.

The remaining charts come from RMLS and show:

Charts of Vancouver WA Home Sales Trends in June 2020 Clark County Home Sales Inventory
& Days on Market - June 2020


New Listings came in at the same lever; while Pending Sales and Closed Sales both moved up. Available Inventory remained the same however, and is at an extremely low level. 

The second graph shows Prices for both Closed Sales and Average Sales each hitting their highest one-month mark ever!

Finally, the Average Days on Market moved up by a few days; while the Median Days on the Market fell slightly. Both are in the range we usually see in early Summer.

Thank you for visiting our Market report for Home Sales in Clark County WA. Please let me know if you have any questions or need help with your home or condo!


PS - The home sale market is changing, prices are still rising, with loan costs presently at RECORD low levels, keeping this an excellent time to List and Sell Your Property with Our Team; or, at least find out what your property is worth!  We offer a no-cost, no-obligation Clark County WA Home Valuation, and invite you to try it out!

PPS - Looking to buy a home or property reasonably soon?  Interest rates are still at historically low rates.  You are invited to visit our web-page for Clark County WA Homes For Sale where it is Quite Easy to search by City, Neighborhood or by Category, with homes and real estate listings from the entire RMLS.  Sign-up Not Required!  The property and home listings shown are provided via many updates each day, and you will be e-mailed hourly with any new matches once you've signed up for a home search.

We also have the MLS Listings for these great towns in Clark County:  Battle Ground WA Real Estate For Sale | Brush Prairie WA Homes For Sale | Camas WA Homes for Sale | Hockinson WA Homes For Sale | La Center WA Homes for sale | Ridgefield WA Homes for sale | Real Estate for sale in Vancouver Washington | Washougal WA Real Estate | Yacolt WA Homes For Sale | Amboy WA Homes For Sale


The information and charts in this Clark County WA real estate update (prepared by Vancouver WA Real Estate Sales Broker, John Slocum, CRS, SFR, our resident statistician) are based on home sales recorded in the Clark County WA MLS system (RMLS), excluding sales of mobile home; and shows the purchase activity since 2009; charting the 3 month Moving average number of sales, and the 12 month Moving average.  This "smoothing" of the trend-data helps illustrate the short-term and longer term trends in Clark County's real estate market.

Disclaimer: as with any real estate statistics, we do our best to provide the best representation at the time the data was acquired and compiled.  The data and reports are deemed reliable but not guaranteed.

Wednesday, April 8, 2020

Real Estate Market Report Clark County WA - March 2020

Crashing Unit-Home Sales With a Lingering Price Rise for Clark County WA in March 2020.

We are starting to see the Pandemic/Government effects on the shutting-down / slowing-down of the economy in the statistics for the local real estate market. Both Pending and Closed sales are down; with Available Inventory moving upwards.  Here are the highlights for this month's report: 

  • Average-Sales Price still has upwards inertia and climbed to $418,115 - another all-time high, with the 12-month/long-term trend line up 3.81% year-over-year;  and the 3-Month Moving Average up 8.11% from this time last year; 
     
  • The Inventory for Resale Real Estate moved upwards 0.4 month's-worth, to a still 1.2 Month level of Supply;
     
  • Approximately 433 Resale Properties were sold/closed, which is about 68 fewer (-13.57%) homes than in 2019; and 46 more than last month;
     
  • REO/Bank Owned property sales were 3 units (0.7% of total); down from 4 (0.8%) in 2019; 
     
  • Short Sale /Pre-Foreclosure property sales were 2 unit (0.46% of total); no change from 2 (0.4%) in 2019.

The Home Mortgage 30-year-fixed loan interest rate (nationwide average) at month-end, went slightly lower to 3.45% (Down from 3.47% last month) according to Freddie Mac; compared to 4.27% for March 2019. With the massive federal response to the Pandemic, we don't expect the loan interest rate to rise.

Next up is my custom chart for Unit-Volume (number of properties sold) showing short term (in Red) and long term (12-month moving average in Blue) trends: 

Clark County Home Sales March 2019- Units Sold Clark County Home Sales - Units Sold Trend March 2020

The Short Term trend last year hit the low-point in February. This month is the lowest-point for our current year; and it is possible this won't bottom-out just yet. The long-term trend also shows some downward direction when it had been going side-ways.   

The chart for Average Home Sales Price is shown next, illustrating the current and past Home-Sales-Price results for both short-term and long-term: 

Clark County Home Sales March 2019- Average Sales Price Trends Clark County Home Sales - Average Sales Price Trend March 2020

The long duration of extremely low level of Active Inventory kept strong upward pressure on Prices; and we are likely seeing inertia in the price-direction for this reporting month.  With the combination of the Pandemic and Financial markets in distress, it is very likely we'll see much softening in sales prices very soon.
 
The Average Sales Price (using 3 months) for Clark County is now $418,115; which is an increase of approximately $31,355 from this time last year.

The remaining set of graphs come from RMLS and show:

Charts of Vancouver WA Home Sales Trends in March 2019 Clark County Home Sales Inventory
& Days on Market - March 2020


New Listings jumped up like we typically have seen in the past; while Pending Sales and Closed Sales both broke-rank and lagged far behind. If this divergence continues we expect the level of Active Inventory to increase rapidly and substantially. 

The second graph shows both the Closed Sales and Average Sales pricing coming in at their highest level ever, which is perhaps not surprising at the Peak of any market run-up.

Finally, Average Days on Market and Median Days on the Market have both fallen like we typically see early in the main Real Estate Selling Season. Time will tell where these two measures will settle in at.

Thank you for visiting our Real Estate Market report for Clark County WA. Please let us know if you have any questions or need help with your home or condo!


PS - The real estate market is changing, prices are softening with loan costs presently at very low levels, keeping this an excellent time to List and Sell Your Property with Our Team; or, at least find out what your property is worth!  We offer a no-cost, no-obligation Clark County WA Real Estate Valuation, and invite you to try it out!

PPS - Looking to buy a property reasonably soon?  Interest rates are still at historically low rates.  You are invited to visit our web-page for Clark County WA Real Estate For Sale where it is Quite Easy to search by City, Neighborhood or by Category, with homes and real estate listings from the entire RMLS.  Sign-up Not Required!  The property and home listings shown are provided via many updates each day, and you will be e-mailed hourly with any new matches once you've signed up for a home search.

We also have the MLS Listings for these great towns in Clark County:  Battle Ground WA Real Estate For Sale | Brush Prairie WA Homes For Sale | Camas WA Homes for Sale | Hockinson WA Homes For Sale | La Center WA Homes for sale | Ridgefield WA Homes for sale | Real Estate for sale in Vancouver Washington | Washougal WA Real Estate | Yacolt WA Homes For Sale | Amboy WA Homes For Sale


The information and charts in this Clark County WA real estate update (prepared by Vancouver WA Real Estate Sales Broker, John Slocum, CRS, SFR, our resident statistician) are based on home sales recorded in the Clark County WA MLS system (RMLS), excluding sales of mobile home; and shows the purchase activity since 2009; charting the 3 month Moving average number of sales, and the 12 month Moving average.  This "smoothing" of the trend-data helps illustrate the short-term and longer term trends in Clark County's real estate market.

Disclaimer: as with any real estate statistics, we do our best to provide the best representation at the time the data was acquired and compiled.  The data and reports are deemed reliable but not guaranteed.