Wednesday, February 25, 2015

Clark County WA Real Estate Market Update for January 2015

Clark County's January 2015 Real Estate Results Come in Strong!

With mild winter weather, and low interest rates for home loans, real estate in Clark County WA broke out early from the typical seasonal slowdown to post strong gains in the number of resale properties sold. Here are the high-points for this month:

  • Approximately 346 Resale Homes were sold in January, which is about 51 (17.3%) more homes than had sold in January 2014.
     
  • The Price Trend Lines show the 3-Month Moving Average with its typical Seasonal Dip, while the 12-Month Moving Average is showing a steady increase.
     
  • Average Home Sale-Prices Were Up strongly, with the 3-Month Moving Average up 9.68% over the prior year; and the 12-Month Moving Average went up 9.13% from the year prior.
     
  • Short Sale /Pre-Foreclosure property sales were 23 units (6.65% of total); vs 40 in January 2014.

  • REO/Bank Owned property sales were 37 units (10.69% of total);  vs 54 in January 2014. 
     

Next up in our Clark County Report will be our Custom Real Estate Market Analysis Charts!  The first chart displays the Number of Resale Homes Sold (Excluding New Construction).  We are using the simple technique of statistical smoothing to show a short term trend line illustrating the 3-month Moving Average; and the longer term trend line representing the 12-month Moving Average. 

Clark County Washington Home Sales January 2015 - Units Sold Clark County WA Resale Home Sales - Units Sold Trend January 2015

Even though we are in the typical slower season of the year, the number of properties sold is much higher than at the same time last year.  We will be on alert to see if this trend continues. 

Next in line is the display for the action on Home Prices in for January 2015.

Clark County WA Home Sales January 2015 - Average Sales Price Trends Clark County WA Resale Home Sales - Average Sales Price Trend

For this major component of the overall Clark County real estate market, Resale Home Inventory is at 2.2 Months, indicating an extreme "Seller's Market! (A more "Normal" Inventory level is considered to by Six (6) Months of Supply)  Thus, there is still continued support for the current, if not increasing price-level for homes.   

The final chats below show the month-by-month action for Unit Sales, Average & Median Prices; and Days on Market:

Charts of Clark County WA Home Sales Trends in January 2015 Clark County Home Sales Inventory & Days on Market Trends


In our opinion it seems clear that the strength in the local real estate market is continuing into 2015; and will likey continue the same positive trends, at least in the near term


PS - Please visit the Home Search page for Clark County WA on our website, where it is Easy to search by Neighborhood or by Category, with property and real estate listings from the entire RMLS.  Sign-up Not Required!

PPS -2015 will be a big year for the Clark County Washington real estate market.  Don't delay with your Home Selling or Buying Plans - Call Us Soon!


The charts in this report (prepared by John Slocum Realtor®, our resident statistician) are based on home sales posted in the Clark County MLS system (RMLS), excluding sales of mobile home; and shows the purchase activity since 2009; charting the 3 month Moving average number of sales, and the 12 month Moving average.  This "smoothing" of the trend-data helps illustrate the short-term and longer term trends in Vancouver WA's real estate market.

Disclaimer: as with any real estate statistical reports, we endeavor to provide the best representation at the time the data was acquired.  The data and reports are deemed reliable but not guaranteed.

Sunday, February 8, 2015

Condos in Vancouver WA Score Big in 2014!

 Condos in Vancouver's Real Estate Market Roared to Life in 2014, with Increases in Average Sales Price and Units Sold.

I love Selling Condos in the Vancouver WA Condo Market (we count Attached homes + Condos), although this is a smaller but important subset of the overall local real estate market, coming in at 14.14% of the total units sold in 2014 (8.5% in 2013).  We've finally seen our "Recovery Year" for Condos with these highlights to report:

  • Values for Vancouver WA Condos moved strongly upward by the end of the year, with the 3-Month Moving Average closing + 34.01% over 2013; and the 12-Month Moving Average closed + 29.15% - Huge gains either way you look at it!
     
  • 2014's  Price Trend for the 3-Month Moving Average showed great strength through the peak Spring and Summer seasons, then dropped in the Fall; and the 12-Month Moving Average chugged along with Strong Upward movement.
      
  • Per RMLS 564 Resale Condos were sold in 2014, and that adds up to 197 (53.68%) more condos sold than in 2013.
     
  • Bank Owned/REO Condo sales were 78 units (13.82% of total); up from 72 (22%) in 2013.  This is a similar result I see when compared with the other cities in Clark County.
     
  • Pre-Foreclosure/Short Sale Condo sales were 33 units (5.85% of total); which is much better than the 84 (26.2%) closed in 2013.

Now for my custom Condo Charts!  This first chart shows the number of Resale Condos Sold (Excludes New Construction), with a short term trend line equaling the 3-month Moving Average; and the longer term trend line equaling the 12-month Moving Average.  We use this modest "smoothing" technique, as the Condo Market in Vancouver is considered small from a statistical point of view, and the monthly numbers jump quite wildly - a behavior we try to tame to better allow the true tends to be visible.

Vancouver Washington Condo Sales 2014 - Units Sold Vancouver WA Condo Sales - Units Sold Trend 2014

Vancouver Condos are included in our recent overall Market Report for Vancouver WA Real Estate this trend line looks somewhat unique - again, this is owing to the relatively small number of units active and sold each month.  To be sure, the 12 month trend-line shows clearly that condo sales have been improving month-over-month for the past 2.5 years or so.

The following chart illustrates the results for Average Condo Prices, with the 3-month moving average line (in red) jumping around quite a bit. This is where the 12-month line (in blue) is superior in defining the underlying trend taking place for any point in time in the market.  In my opinion we've seen the major "bottom" for prices. 

Vancouver WA Condo Sales 2014 - Average Sales Price Trends Vancouver WA Condo Sales - Average Sales Price Trend


I am receiving many calls and inquiries so far this year from customers that want to:

  • Relocate to Vancouver and purchase a Condo;
  • Right-size (fka down-size) to a Condo;
  • Live in Downtown Vancouver or, at Vancouver's Waterfront;
  • Move to Vancouver and escape the high personal Income Taxes from their home state 

Whatever the reason for looking at Condos in Vancouver (or Selling one), I'm glad to be of assistance!


PS - Visit our Main Vancouver WA Condos For Sale page at our website, where we have made it Easy to search Condos by Neighborhood, with condo listings from the entire RMLS.  Sign-up Not Required!

Here are some of our popular Condo Pages:

PPS - Don't delay with your Condo Selling or Buying Plans - Call Us Soon!


The charts in this report (prepared by Vancouver WA Realtor® John Slocum, our resident statistician) are based on condo sales recorded in the Vancouver MLS system (RMLS), excluding sales of newly constructed condos; and shows the purchase activity since 2009; charting the 3 month Moving average number of sales, and the 12 month Moving average.  This "smoothing" of the trend-data helps illustrate the short-term and longer term trends in Vancouver's Condo market.

Disclaimer: as with any real estate statistics, we do our best to provide the best representation at the time the data was acquired.  We deem the data and reports reliable but not guaranteed.

Wednesday, January 28, 2015

Outstanding Gains in Camas WA Real Estate for 2014

Homes For Sale in Camas WA turn in Strong Gains for 2014

In an about-face from the Fourth Quarter 2013's major price dip, the Fall of 2014 average sales price fell slightly; finishing the year with excellent improvement in Average Sales price and level of Distressed Properties.  Here are some of the highlights for 2014:

  • REO/Bank Owned property sales were 30 units (6.71% of total); down from 40 (8.58%) in 2013. 
     
  • Short Sale /Pre-Foreclosure property sales were 19 units (4.25% of total); down from 49 (10.52%) in 2013.
  • Prices Indexes Were Strongly Up, with the 3-Month Moving Average Up 27.6% (Dec13 vs. Dec14); while the 12-Month Moving Average went up 10.8%
     
  • The Inventory level for Resale Homes is at 2.4 Months - going still farther into the range of a Strong "Seller's Market."
     
  • Approximately 447 Resale Homes closed in 2014, compared to 466 Sold in 2013; a decrease of 19 homes or, -4.25%.

The Big news is absolutely the ever shrinking inventory of Resale Homes in the Camas real estate market area.  A "Normal" market is 6 months of Inventory (amount of homes available for sale in the market) -- when the home inventory is at 2.4 months it leaves fewer choices for Home Shoppers, and applies upward pressure on prices. 

 Moreover, with the inventory level at this low level, it will also cause many home shoppers to expand their geographic search area; and in this case, to include nearby areas such as Vancouver WA Homes For Sale and Washougal Homes For Sale.

Now for charts from RMLS:

Charts of Camas WA Resale Home Sales Trends in 2014 Resale Home Sales Camas WA Inventory & Days on Market - 2014

This collection of 3 charts from RMLS illustrate the dynamics for Units Sold, List and Sales Price Averages; and Cumulative Days on Market (CDOM).  The top chart shows a surge of new listings in the Spring through Summer, then tapering down for the rest of the year; with a very significant number of closings taking place in October (an amount we'd more typically expect in the summer months.).  The next chart is showing that the new listings are pulling up the Average Listed price, with the buyer's in there unable to negotiate down.  The final graph shows the relatively short time to sell a Camas home early in the year, with the market time appearing more "normal" in the final four months.


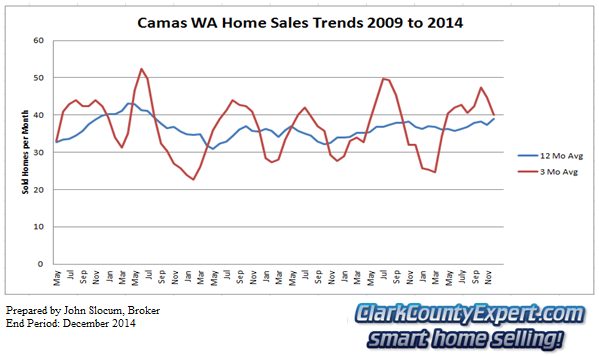
Now for John's Camas Charts! - The first custom chart represents the number of Resale Homes Sold (Excludes New Construction), with the short term trend line (in Red) calculated as a 3-Month Moving Average; and the long term trend line (Blue line) equaling the 12-month Moving Average.

Camas Resale Home Sales 2014 - Units Sold Resale Home Sales  Camas WA - Units Sold Trend 2014

This chart shows slight change in unit-home sales for Camas, while the Vancouver WA home sales trend is up for the year.

Moving to the current results for Average Home Prices (chart below), the short term trend-line shows that Camas jumped up strongly starting early in the year; and with low inventory the buyers have had no choice but to push prices higher.  The long-term trend line also shows a upward price-change direction.

Camas Resale Home Sales 2014 - Average Sales Price Trends Resale Home Sales Camas WA - Average Sales Price Trend 2014


Please contact me if you have any questions with this report!

PS - Please visit my website for the Camas Home and Real Estate page, where we have 16 neighborhood searches already set up in addition to 7 category searches, with property listings from the entire RMLS.

PPS - I believe Camas home sales will be strong in 2015.  Don't delay with your Home Selling or Buying Plans - Call Us Soon!


The Camas Real Estate charts in this report (prepared by Camas WA Realtor® John Slocum, our resident statistician) are based on home sales recorded in the Camas  MLS system (RMLS), excluding sales of mobile home; and shows the purchase activity since 2009; charting the 3 month Moving average number of sales, and the 12 month Moving average.  This "smoothing" of the trend-data helps illustrate the short-term and longer term trends in the Camas real estate market.

Disclaimer: as with any real estate statistics, we do our best to provide the best representation at the time the data was acquired.  We deem the data and reports reliable but not guaranteed.

Friday, January 23, 2015

Active Real Estate Listings Down in Vancovuer WA

In putting a finer-focus on the Real Estate results for the market in Vancouver, one of the charts from the RMLS Market Action Report for December stands out -- namely, the total number of Available Residential Listings dropped significantly when compared to the same month in previous years!


To solve this minor mystery we only had to look a little further down in the report to see that Pending Home Sales took a jump up for the same month. Clearly, we have a more confident (or, anxious --> Active) pool of home buyers in the current season.

Almost equally as Clear, is that the local real estate market needs more listings Available to sell! Vancouver's market is slightly different than in Portland, where there are an abundance of listings in the "New Home" category that don't truly exist yet; but rather, are "Proposed" listings (i.e., marketing bait). In accounting for this element that is not immediately available for sale and occupancy, combined with the Short Sale Pending listings, when these two categories are removed the number of True Available Listings are 69.9% of the number indicated in the above Chart!!!

Please view our more comprehensive video report please visit: Vancouver WA Real Estate Market Report for December 2014.

To help cure the shortage of Available Home Listings we need more home sellers to step up and put their homes on the market.  As Vancouver WA Real Estate Listing Agents we're only too glad to help!!! Check us out, then give us a call!


Wednesday, January 21, 2015

2014 Real Estate Market Shows Gains for Vancouver WA

Real Estate in Vancouver WA for 2014 Came Through With Strong Results!

The Year 2014 Closed out even stronger than the Year before, with Less of a seasonal slowdown in the 4th Quarter. Here are this year's highlights:

  • Approximately 3,989 Resale Homes were sold in 2014, which is about 158 (4.12%) more homes than had sold in 2013.
     
  • The Price Trend Lines show the 3-Month Moving Average with its typical Seasonal Peak in July at $256k, and the 12-Month Moving Average peaking at the end of the year.
     
  • Average Home Sale-Prices Were Up strongly, with the 3-Month Moving Average up 13.65% over the prior year; and the 12-Month Moving Average went up 10.34% from the year prior.
     
  • Short Sale /Pre-Foreclosure property sales were 303 units (7.6% of total); also trending downward.
  • REO/Bank Owned property sales were 426 units (10.7% of total); and trending downward through the year. 
     

The video below, John Slocuum, Realtor® talks about the 2014 Vancouver real estate market's highlights:

Vancouver WA Real Estate Video Report Annual 2014

Now for our Real Estate Market Analysis Charts!  The first chart displays the quantity of Resale Homes Sold (Excludes New Construction).  We are using the simple technique of statistical smoothing to show a short term trend line equaling the 3-month Moving Average; and the longer term trend line equaling the 12-month Moving Average. 

Vancouver Washington Home Sales March 2014 - Units Sold Vancouver WA Resale Home Sales - Units Sold Trend Annual 2014

With Vancouver clearly the largest reporting area in Vancouver WA, the Clark County overall trend line will look quite a bit like this one. 

Next up is the display for the action on Home Prices in 2014.

Vancouver WA Home Sales Annual 2014 - Average Sales Price Trends Vancouver WA Resale Home Sales - Average Sales Price Trend

THE BIG reason for Vancouver's increase in average sales price is the relatively very low inventory (home supply) condition we've seen through the year, ending at less than 3 months supply for Resale Homes!   

The final chats below show the month-by-month action for Unit Sales, Average & Median Prices; and Days on Market:

Charts of Vancouver WA Home Sales Trends in Annual 2014 Vancouver Home Sales Inventory & Days on Market Trends


In our opinion it appears that 2015 should continue the same positive trends, at least in the near term


PS - Please visit the Home Search page for Vancouver WA on our website, where it is Easy to search by Neighborhood or by Category, with property and real estate listings from the entire RMLS.  Sign-up Not Required!

PPS -2015 will be a big year for the Vancouver real estate market.  Don't delay with your Home Selling or Buying Plans - Call Us Soon!


The charts in this report (prepared by John Slocum Realtor®, our resident statistician) are based on home sales posted in the Vancouver MLS system (RMLS), excluding sales of mobile home; and shows the purchase activity since 2009; charting the 3 month Moving average number of sales, and the 12 month Moving average.  This "smoothing" of the trend-data helps illustrate the short-term and longer term trends in Vancouver WA's real estate market.

Disclaimer: as with any real estate statistics, we do our best to provide the best representation at the time the data was acquired.  We deem the data and reports reliable but not guaranteed.

Friday, April 18, 2014

21109 NE Risto Rd - Gorgeous Custom Home, Hockinson Schools!

21109 NE RIsto Rd - Awesome Custom Home on Greenbelt


Overview
Maps
Photos
Description
Market Stats


$550,000
Single Family Home
Main Features
3 Bedrooms
2 Bathrooms
Interior: 3,222 sqft
Lot: 1.59 acre(s)
Location
21109 NE Risto Rd
Battle Ground, WA 98604
USA

John Slocum & Kathryn Alexander

John Slocum & Kathryn Alexander

RE/MAX equity group
(360) 258-2494
clagent@clarkcountyexpert.com
http://www.clarkcountyexpert.com


Listed by: Kathryn Alexander

Our recent listings
Subscribe to our listing feed

Nearby properties for sale


Powered By RealBird.com


Real Estate Market Report for Vancouver WA - March 2014

Vancouver's Real Estate in March 2014 Showing a Good Pace.

March marks the end of The First Quarter of 2014 and finds the Vancouver WA Real Estate market still struggling with low inventory of resale homes. Here are this month's highlights:

  • The Average Home Sale-Price Moved Up again; showing the 3-Month Moving Average up 12.66% over the prior year; and the 12-Month Moving Average went up 12.39% from the prior March.
     
  • The Price Trend Lines were also progressing in the Upward Direction for both the 3-Month Moving Average, and the 12-Month Moving Average.
     
  • 266 Resale Homes were sold in March, which is about 23 (8%) fewer homes than had sold in March 2013.

  • 371 Resale Homes went Pending; vs. 323 in the prior year.
     
  • REO/Bank Owned property sales were 36 units (13.5% of total); up from 33 (11.42%) in March 2013. 
     
  • Short Sale /Pre-Foreclosure property sales were 38 units (14.3% of total); down from 53 (18.3%) in March 2013.

We advise that Vancouver Washington is a relatively small reporting area and thus, the results for each month must be merged with existing data to effect "smoothing" to allow the trends to better reveal themselves. 

Another "quirky item" that is difficult to capture is that some homes may go Pending - to - Sold in the same month; while others may go Pending in one month, and become a Closed sale more than one month following!

Finally, the Closed Sale of one or more million-dollar(+) home in a month can raise the Average Sales price for Vancouver measurably for a one-month report; while blending that information into several month's of data smoothes out that effect.

Now for our Charts for Vancouver Real Estate!  The first chart displays the number of Resale Homes Sold (Excludes New Construction).  We are using the simple statistical smoothing techniques mentioned above, to show a short term trend line equaling the 3-month Moving Average; and the longer term trend line equaling the 12-month Moving Average. 

Vancouver Washington Home Sales March 2014 - Units Sold Vancouver WA Resale Home Sales - Units Sold Trend March 2014

With Vancouver being the largest reporting area in Clark County WA, this trend line will look very similar the one for the County. 

Next up is the display for the current action on Home Prices. This month Vancouver WA's overall price trend-lines were flat, while Vancouver's rose!

Vancouver WA Home Sales March 2014 - Average Sales Price Trends Vancouver WA Resale Home Sales - Average Sales Price Trend

We opine that part of the reason for Vancouver's increase in average sales price is the relatively very low inventory (home supply) condition we've seen recently.   

The final series of chats below show the month-by-month action for Unit Sales, Average & Median Prices; and Days on Market:

Charts of Vancouver WA Home Sales Trends in March 2014 Vancouver Home Sales Inventory & Days on Market Trends

These final 3 charts show the market behavior around the beginning of the year, with Days on Market higher than the summer time but, lower than they were the same time last year.

We also notice that the new listings coming on the market are "pushing" the price envelope upward, visible by March's average list price being much higher than at any time in the previous 12 months.

We opine that 2014 is starting out almost as strong as 2013 did.  The unit-volume is slightly less, most likely owing to low available inventory.  The severe winter in other parts of the country could also be having some effect near-term as the normal in-bound buyers from those states have been weather-delayed!


PS - Visit the Home Search for Vancouver WA on our website, where it is Easy to search by Neighborhood or by Category, with property and real estate listings from the entire RMLS.  Sign-up Not Required!

PPS -2014 is shaping up to be a big year for the real estate market.  Don't delay with your Home Selling or Buying Plans - Call Us Soon!


The charts in this report (prepared by John Slocum Realtor®, our resident statistician) are based on home sales recorded in the Vancouver MLS system (RMLS), excluding sales of mobile home; and shows the purchase activity since 2009; charting the 3 month Moving average number of sales, and the 12 month Moving average.  This "smoothing" of the trend-data helps illustrate the short-term and longer term trends in Vancouver WA's real estate market.

Disclaimer: as with any real estate statistics, we do our best to provide the best representation at the time the data was acquired.  We deem the data and reports reliable but not guaranteed.