Wednesday, May 15, 2019

Clark County WA Home Sales - April 2019 Report

Home Sales in the Seasonal Upswing, although at a Slower Pace for Clark County WA in April 2019.

Closed Unit-Sales fell only 14 units compared last year in the same month - and Down 92 units (-4.95%) year-to-date; while the short-term price-trend fell slightly from last month. Here are this month's key points: 
  • Average-Sales Price increases are slowing, with the 12-month/long-term trend line up 6.72% year-over-year;  with the 3-Month Moving Average up 1.9% from this time last year; 
     
  • The Inventory for Resale Homes rose 0.3 months, and is now at (the still low) 1.8 Months of Supply;
     
  • Approximately 520 Resale Homes closed in the month, which is about 14 fewer (-2.6%) homes than in 2018; and 29 more than last month;
     
  • REO/Bank Owned property sales were 9 units (1.7% of total); up from 8 (1.5%) in 2018; 
     
  • Short Sale /Pre-Foreclosure property sales were 5 units (0.96% of total); up from 0 (0%) in 2018.
For Financing costs we see the month-end, 30-year-fixed home loan interest rate (nationwide average) is 4.14% (Down from 4.27% last month) according to Freddie Mac; compared to 4.47% for April 2018. The current rate level is lowest it has been in the past 14 months!

Continuing on I have prepared a Unit-Volume (number of homes sold) chart showing the short term (in red) and long term (12-month moving average in Blue) trends (shown below): 
Clark County Home Sales April 2019- Units Sold Clark County Home Sales - Units Sold Trend April 2019
The Short-term trend line is rising nicely from the seasonal low; with the long-term trend appearing to be moving side-ways now, instead of going lower.

The next chart shows the Average Home Sales Price trends, both short-term and long-term: 


Clark County Home Sales April 2019- Average Sales Price Trends Clark County Home Sales - Average Sales Price Trend April 2019
Without a doubt, the start of this year's "high season" is showing a very soft profile to the price trend, which is very different when compared to the same time period in the past 5 years. This pattern makes great sense in light of a real estate market that is slowing locally and nationwide.

The short term Average sales price for Clark County is now $386,869; which is an increase of approximately $7,200 from the same month last year.

The final graphs are from RMLS and show:
Charts of Vancouver WA Home Sales Trends in April 2019 Clark County Home Sales Inventory
& Days on Market - April 2019

This month we see New Listings growing at a steeper slope than Pending Sales and Closed Sales are. This is one reason the Active Inventory level has risen modestly. 

The second graph with the Average List and Sales Prices shows the average price for new listings again moving to a very high level. 

Both Average Days and Median Days on the Market fell substantially, which is what we expect at this stage of the high-season.

For the recent RMLS published report on the Clark County real estate scene you can find it here: RMLS Market Action Report on our main website.

Thank you for visiting our report; and please let us know if you have any questions or need help with your home or condo!


PS - The home sales market is in change-mode as prices are softer with loan costs now falling, keeping this an excellent time to List and Sell Your Home with Our Team; or, at least find out what your home is worth!  We offer a no-cost, no-obligation Clark County WA Home Valuation, and invite you to try it out!

PPS - Looking to buy a home reasonably soon?  Interest rates have been falling and are still at historically low rates.  You are invited to visit our web-page for Clark County WA  Homes For Sale where it is Quite Easy to search by City, Neighborhood or by Category, with homes and real estate listings from the entire RMLS.  Sign-up Not Required!  The property and home listings shown are provided via many updates each day, and you will be e-mailed hourly with any new matches once you've signed up for a home search.

We also have the MLS Listings for these great towns in Clark County:  Battle Ground WA Homes For Sale | Brush Prairie WA Homes For Sale | Camas WA Homes for Sale | Hockinson WA Homes For Sale | La Center WA Homes for sale | Ridgefield WA Homes for sale | Homes for sale in Vancouver Washington | Washougal WA Real Estate | Yacolt WA Homes For Sale | Amboy WA Homes For Sale


The information and charts in this Clark County WA real estate update (prepared by Vancouver WA Real Estate Broker, John Slocum, CRS, SFR, our resident statistician) are based on home sales recorded in the Clark County WA MLS system (RMLS), excluding sales of mobile home; and shows the purchase activity since 2009; charting the 3 month Moving average number of sales, and the 12 month Moving average.  This "smoothing" of the trend-data helps illustrate the short-term and longer term trends in Clark County's real estate market.

Disclaimer: as with any real estate statistics, we do our best to provide the best representation at the time the data was acquired and compiled.  The data and reports are deemed reliable but not guaranteed.

Monday, May 13, 2019

Warmer Weather is Coming - Is Your Comfort System Ready?

Heating and air-conditioning are frequently referred to as the "comfort systems."  If one has gone out in the dead of winter or the heat of summer, lack of comfort becomes a primary concern.  Regular maintenance with a HVAC checklist is something that homeowners can do themselves to ensure that the units operate properly.
Periodically
  • Change your filter every 90 days; every 30 days if you have shedding pets. 
  • Maintain at least two feet of clearance around outdoor air conditioning units and heat pumps.
  • Don't allow leaves, grass clippings, lint or other things to block circulation of coils.
  • Inspect insulation on refrigerant lines leading into house monthly and replace if missing or damaged.
Annually, in spring
  • Confirm that outdoor air conditioning units and heat pumps are on level pads.
  • Pour bleach in the air conditioner's condensation drain to clear mold and algae which can cause a clog.
  • Avoid closing more than 20% of a home's registers to keep from overworking the system.
  • Replace the battery in the home's carbon monoxide detector.

While using this list will prevent some things that may impede the comfort system's proper performance, it is recommended that you have your units serviced annually by a licensed contractor.  Furnaces should also be inspected for carbon monoxide leaks. Preventative maintenance may help avoid costly repairs.

Monday, April 15, 2019

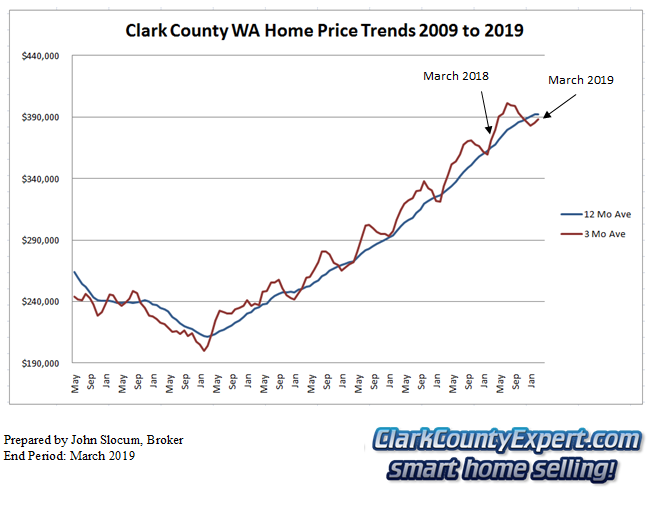
Clark County WA Real Estate - March 2019 Report

Unit-Sales Coming in Lower While Prices Seem to be Moderating Their Ascent for Clark County WA in March 2019.

This month Closed Unit-Sales slid by 50 units compared to the same month last year; while the short-term price-trend returned to upward, albeit less-steep direction. Here are the highlights for this month: 
  • Average-Sales Price is increasing moderately, with the 12-month/long-term trend line up 7.46% compared to last year at this time;  and the 3-Month Moving Average is up 4.56% from March last year; 
     
  • The Inventory for Resale Homes rose 0.1 months, and is now at (a still very low) 1.5 Months of Supply;
     
  • Approximately 480 Resale Homes closed in the month, which is about 50 fewer (-9.4%) homes than in 2018; and 100 more than last month;
     
  • REO/Bank Owned property sales were 3 units (0.6% of total); down from 12 (2.3%) in 2018; 
     
  • Short Sale /Pre-Foreclosure property sales were 2 units (0.4% of total); down from 9 (1.7%) in 2018.
The month-end, 30-year-fixed home loan benchmark interest rate is 4.27% (Down from 4.37% last month) according to Freddie Mac; compared to 4.44% for March 2018. In fact, the current rate level is lowest it has been in the past 12 months!

Next up we have created a Unit-Volume (number of homes sold) chart showing the short term (in red) and long term (12-month moving average in Blue) trends (shown below): 
Clark County Home Sales March 2019- Units Sold Clark County Home Sales - Units Sold Trend March 2019
This month we see the Short-term trend line moving up off the seasonal low; while the long-term trend is still drifting downwards. With lower sales this month we expect the long term trend will still go lower.

Next we have the Average Home Sales Price trends, both the short-term and long-term: 


Clark County Home Sales March 2019- Average Sales Price Trends Clark County Home Sales - Average Sales Price Trend March 2019
So far this season it is clear that there has been a moderation in the price increase - with the less-inclined slope of the short-term line. This has been strong enough to have the long-term line flatten out a little.

The short term Average sales price for Clark County is now $388,250; which is an increase of approximately $16,947 from the same time last year.

The remaining graphs are from RMLS and show:
Charts of Vancouver WA Home Sales Trends in March 2019 Clark County Home Sales Inventory
& Days on Market - March 2019

New Listings, Pending Sales and Closed Sales have all risen this month. A clear sign the sales season for 2019 is ramping up. 

The second graph with the Average List and Sales Prices shows the average price for new listings has come back in line with a more modest level above the closed sales price. 

Average Days on the Market fell be a few days while the Median came down by about a week. Surely a good sign the hot season for home sales has begun.

For the most recent RMLS published report on the Clark County real estate scene you can find it here: RMLS Market Action Report on our main website.

Thank you for visiting our report; and please let us know if you have any questions or need help with your home or condo!


PS - The home sales market is adjusting to the much higher prices combined with loan costs that have been falling, this is an excellent time to List and Sell Your Home with Our Team; or, at least find out what your home is worth!  We offer a no-cost, no-obligation Clark County WA Home Valuation, and invite you to try it out!

PPS - Looking to buy a home reasonably soon?  Interest rates have been falling and are still at historically low rates.  You are invited to visit our web-page for Clark County WA  Homes For Sale where it is Quite Easy to search by City, Neighborhood or by Category, with homes and real estate listings from the entire RMLS.  Sign-up Not Required!  The property and home listings shown are provided via many updates each day, and you will be e-mailed hourly with any new matches once you've signed up for a home search.

We also have the MLS Listings for these great towns in Clark County:  Battle Ground WA Real Estate | Brush Prairie WA Homes | Camas WA Homes For Sale | Hockinson WA Homes | La Center WA Homes for sale | Ridgefield WA Homes for sale | Homes for sale in Vancouver Washington | Washougal WA Real Estate | Yacolt WA Homes | Amboy WA Homes


The information and charts in this Clark County WA real estate update (prepared by Vancouver WA Real Estate Broker, John Slocum, CRS, SFR, our resident statistician) are based on home sales recorded in the Clark County WA MLS system (RMLS), excluding sales of mobile home; and shows the purchase activity since 2009; charting the 3 month Moving average number of sales, and the 12 month Moving average.  This "smoothing" of the trend-data helps illustrate the short-term and longer term trends in Clark County's real estate market.

Disclaimer: as with any real estate statistics, we do our best to provide the best representation at the time the data was acquired and compiled.  The data and reports are deemed reliable but not guaranteed.

Tuesday, April 2, 2019

Homes For Sale Clark County WA - February 2019 Report

Unit-Sales Fall While Prices Return to a Rising Pattern for Clark County WA in February 2019.

This month Unit-Sales took quite a hit dropping 45 units compared to the same month last year; while the short-term price-trend returned to an upward direction. Here are highlights for this month: 
  • Average-Sales Price measures started to increase, with the 12-month/long-term trend line up 8.24% compared to last year at this time;  and the 3-Month Moving Average is up 7.07% from February last year; 
     
  • The Inventory for Resale Homes rose 0.2 months, and is now at (a still low) 1.4 Months of Supply;
     
  • Approximately 377 Resale Homes closed in the month, which is about 45 fewer (-10.7%) homes than in 2018; and only 4 more than last month.
     
  • REO/Bank Owned property sales were 2 units (0.5% of total); down from 4 (0.9%) in 2018. 
     
  • Short Sale /Pre-Foreclosure property sales were 1 unit (0.27% of total); down from 5 (1.2%) in 2018.
The month-end, 30-year-fixed home loan benchmark interest rate is 4.37% (Down from 4.46% last month) according to Freddie Mac; compared to 4.33% for February 2018. In fact, the current rate level is lower than it was for the last 10 months of 2018.

I have created a Unit-Volume (number of homes sold) chart that shows the short term (in red) and long term (12-month moving average in Blue) trends (shown below): 
Clark County Home Sales February 2019- Units Sold Clark County Home Sales - Units Sold Trend February 2019
The Short-term trend line is now at a level that hasn't been seen in over four years, and the long-term line is not far behind. With the drop in sales this month it is clear the local market is seeking a lower level of sales activity.

Next is the chart for Average Home Sales Price trends, both the short-term and long-term: 


Clark County Home Sales February 2019- Average Sales Price Trends Clark County Home Sales - Average Sales Price Trend February 2019

The short term Average sales price for Clark County is now $384,830; which is an increase of approximately $25,427 from the same time last year.

The final set of charts are from RMLS and show:
Charts of Vancouver WA Home Sales Trends in February 2019 Clark County Home Sales Inventory
& Days on Market - February 2019

New Listings and Pending Sales have stalled with both ending the month at the same level; while Closed Sales also stalled although at a lower level. Active Inventory held steady but is still far too low. 

The second graph with the Average List and Sales Prices shows the average price for new listings greatly exceeding the levels seen in the past year; while closed sales prices came in lower than seen recently. 

Days on the Market, Average and Median, both came down several days - sign the market temperature is warming.

For the latest RMLS published report on the Clark County real estate scene you can find it here: RMLS Market Action Report on our main website.

Thank you for visiting our report; and please let us know if you have any questions or need help with your home or condo!


PS - The real estate market is adjusting to the much higher prices combined with higher loan costs however, this is still a good time to List and Sell Your Home with Our Team; or, at least find out what your home is worth!  We offer a no-cost, no-obligation Clark County WA Home Valuation, and invite you to try it out!

PPS - Looking to buy a home reasonably soon?  Interest rates are still at historically low rates.  You are invited to visit our web-page for Clark County WA  Homes For Sale where it is Quite Easy to search by City, Neighborhood or by Category, with homes and real estate listings from the entire RMLS.  Sign-up Not Required!  The property and home listings shown are provided via many updates each day, and you will be e-mailed hourly with any new matches once you've signed up for a home search.

We also have the MLS Listings for these great towns in Clark County:  Battle Ground WA Real Estate | Brush Prairie WA Homes | Camas WA Homes For Sale | Hockinson WA Homes | La Center WA Homes for sale | Ridgefield WA Homes for sale | Homes for sale in Vancouver Washington | Washougal WA Real Estate | Yacolt WA Homes | Amboy WA Homes


The information and charts in this Clark County WA real estate update (prepared by Vancouver WA Real Estate Broker, John Slocum, CRS, SFR, our resident statistician) are based on home sales recorded in the Clark County WA MLS system (RMLS), excluding sales of mobile home; and shows the purchase activity since 2009; charting the 3 month Moving average number of sales, and the 12 month Moving average.  This "smoothing" of the trend-data helps illustrate the short-term and longer term trends in Clark County's real estate market.

Disclaimer: as with any real estate statistics, we do our best to provide the best representation at the time the data was acquired and compiled.  The data and reports are deemed reliable but not guaranteed.

Friday, March 8, 2019

Homes for sale in Clark County WA - January 2019 Report

Unit-Sales and Prices Come in Reasonably Well for Clark County WA for January 2019.

Unit-Sales for pre-owned homes came in just 2 units shy of the same month last year; which we see as a push; while the year-over-year prices are about 6% higher. Below are highlights for this month: 
  • Average-Sales Price increases are slowing, with the 12-month/long-term trend line up 8.48% compared to last year at this time;  and the 3-Month Moving Average is up 5.98% from January last year; 
     
  • The Inventory for Resale Homes fell 0.2 months, and is now at 1.2 Months Supply;
     
  • Approximately 370 Resale Homes closed in the month, which is about 2 fewer (-0.5%) homes than in 2018; and 53 fewer than last month.
     
  • REO/Bank Owned property sales were 4 units (1.1% of total); no change from 4 (1.1%) in 2018. 
     
  • Short Sale /Pre-Foreclosure property sales were 3 units (0.8% of total); up from 1 (0.3%) in 2018.
The month-end, 30-year-fixed home loan benchmark interest rate is 4.46% (Down from 4.46% last month) according to Freddie Mac; compared to 4.03% for January 2018.

Next up we have our Unit-Volume (number of homes sold) chart that shows the short term (in red) and long term (12-month moving average in Blue) trends (shown below): 
Clark County Home Sales January 2019- Units Sold Clark County Home Sales - Units Sold Trend January 2019
Both trend-lines are Lows for the most recent years. With home-loan rates dropping back down some, and if prices moderate, we expect unit-sales to resume at a reasonable pace soon.

Next we chart the Average Home Sales Price trends, both the short-term and long-term: 


Clark County Home Sales January 2019- Average Sales Price Trends Clark County Home Sales - Average Sales Price Trend January 2019

The short term Average sales price for Clark County is now $383,486; now down about $18,000 from the peak this past summer. This still represents an increase of approximately $21,638 from the same time last year.

The final set of charts from RMLS show:
Charts of Vancouver WA Home Sales Trends in January 2019 Clark County Home Sales Inventory
& Days on Market - January 2019

New Listings and Pending Sales have made their turn upwards for the new year; while Closed Sales reflect a typical level of closings for this month of the year. Active Inventory also fell slightly, but we believe that will improve in the next few months . 

The second graph with the Average List and Sales Prices shows new listings and closed sales both coming in relatively strong (higher). 

Days on the Market, Average and Median, both moved upwards a fair amount but we also expect that to turn around in the next couple of months time.

The latest RMLS published report on the Clark County real estate scene can be found here: RMLS Market Action Report on our main website.

Thank you for viewing our report; and please let us know if you have any questions or need help with your home or condo!


PS - The real estate market is adjusting to the much higher prices combined with higher loan costs however, this is still a good time to List and Sell Your Home with Our Team; or, at least find out what your home is worth!  We offer a no-cost, no-obligation Clark County WA Home Valuation, and invite you to try it out!

PPS - Looking to buy a home reasonably soon?  Interest rates are still at historically low rates.  You are invited to visit our web-page for Clark County WA  Homes For Sale where it is Quite Easy to search by City, Neighborhood or by Category, with homes and real estate listings from the entire RMLS.  Sign-up Not Required!  The property and home listings shown are provided via many updates each day, and you will be e-mailed hourly with any new matches once you've signed up for a home search.

We also have the MLS Listings for these great towns in Clark County:  Battle Ground WA Real Estate | Brush Prairie WA Homes | Camas WA Homes For Sale | Hockinson WA Homes | La Center WA Homes for sale | Ridgefield WA Homes for sale | Homes for sale in Vancouver Washington | Washougal WA Real Estate | Yacolt WA Homes | Amboy WA Homes


The information and charts in this Clark County WA real estate update (prepared by Vancouver WA Real Estate Broker, John Slocum, CRS, SFR, our resident statistician) are based on home sales recorded in the Clark County WA MLS system (RMLS), excluding sales of mobile home; and shows the purchase activity since 2009; charting the 3 month Moving average number of sales, and the 12 month Moving average.  This "smoothing" of the trend-data helps illustrate the short-term and longer term trends in Clark County's real estate market.

Disclaimer: as with any real estate statistics, we do our best to provide the best representation at the time the data was acquired and compiled.  The data and reports are deemed reliable but not guaranteed.
Saturday, January 26, 2019

January is a Great Time for a Home Inventory

Generally speaking, when you need an inventory of your personal belongings, it is too late to make one.  Sure, you can reconstruct it but undoubtedly, you'll forget things and that can cost you money when filing your insurance claim.
Most homeowner's policies have a certain amount of coverage for personal items that can be 40-60% of the value of the home.
Homeowners who have a loss are usually asked by the insurance company for proof of purchase which can come in the form of a receipt or current inventory of their personal belongings.
The most organized people might find it difficult, if not impossible, to find receipts for the valuable things in their home.  Think about when you're rummaging around a drawer or closet looking for something else and you discover something that you had totally forgotten that you had.
An inventory is like insurance for your insurance policy to be certain that you list everything possible if you need to make a claim.  Systematically, make a list of the items by going through the rooms, along with the drawers and closets.  In a clothes closet, you can list the number of shirts, pants, dresses and pairs of shoes but higher cost items should be listed separately.
Photographs and videos can be adequate proof that the items belonged to the insured.  A series of pictures of the different rooms, closets, cabinets and drawers can be very helpful.  When video is used, consider narrating as it is shot and be sure to go slow enough and close enough to see the things clearly.
For more suggestions and an easy to use, interactive form, download a Home Inventory, complete it, and save a copy off premise, either in a safety deposit box or digitally in the cloud if you have server-based storage available like Dropbox.
home inventory 001.png

Thursday, January 10, 2019

Real Estate Sales Report - December 2018

Another Monthly Drop in Real Estate Sales for Clark County WA for December 2018.

Resale (pre-owned) properties are down significantly again this month, at 134 units lower than the same month last year. Here are the highlights for this month: 
  • Average-Sales Prices are weakening, with the 12-month/long-term trend line up 8.64% compared to last year at this time;  and the 3-Month Moving Average is up 5.70% from December last year; 
     
  • The Inventory for Resale Homes again fell and is now at 1.5 Months Supply;
     
  • Approximately 387 Resale Homes closed in the month, which is about 134 fewer (-25.7%) homes than in 2017; and 109 fewer than last month.
     
  • REO/Bank Owned property sales were 3 units (0.8% of total); down from 4 (0.8%) in 2017. 
     
  • Short Sale /Pre-Foreclosure property sales were 0 units (0.0% of total); down from 4 (0.8%) in 2017.
The month-end, 30-year-fixed home loan benchmark interest rate is 4.64% (Down quite a bit from the peak of 4.87% last month) according to Freddie Mac; compared to 3.95% for December 2017.

We now come to our Unit-Volume chart that illustrates the short term (in red) and long term (12-month moving average in Blue) trends (shown below): 
Clark County Home Sales December 2018- Units Sold Clark County Home Sales - Units Sold Trend December 2018
Both trend-lines are declining significantly. The higher home-loan rates, combined with very low inventory, is making it more difficult to keep the unit-volume numbers as high as they had been.

Up next is the chart for Average Home Sales Price trends, both the short-term and long-term: 


Clark County Home Sales December 2018- Average Sales Price Trends Clark County Home Sales - Average Sales Price Trend December 2018

The short term Average sales price for Clark County is now $387,607; now down about $14,000 from the peak this past summer. This is however, an increase of approximately $20,887 from the same month last year.

Our last set of charts from RMLS show:
Charts of Vancouver WA Home Sales Trends in December 2018 Clark County Home Sales Inventory
& Days on Market - December 2018

New Listings, Pending Sales and Closed Sales are consistent with this time of year and going lower. Active Inventory fell slightly again this month. 

The second graph with the Average List and Sales Prices shows new listings and closed sales both lower than the prior month. 

Days on the Market, Average and Median, moved back up which is expected at this time of year.

The latest RMLS published report on the Clark County real estate scene can be found here: RMLS Market Action Report on our main website.


PS - The real estate market is adjusting to the much higher prices combined with higher loan costs however, this is still a good time to List and Sell Your Home with Our Team; or, at least find out what your home is worth!  We offer a no-cost, no-obligation Clark County WA Home Valuation, and invite you to try it out!

PPS - Looking to buy a home reasonably soon?  Interest rates are still at historically low rates.  You are invited to visit our web-page for Clark County WA  Homes For Sale where it is Quite Easy to search by City, Neighborhood or by Category, with homes and real estate listings from the entire RMLS.  Sign-up Not Required!  The property and home listings shown are provided via many updates each day, and you will be e-mailed hourly with any new matches once you've signed up for a home search.

We also have the MLS Listings for these great towns in Clark County:  Battle Ground WA Real Estate | Brush Prairie WA Homes | Camas WA Homes For Sale | Hockinson WA Homes | La Center WA Homes for sale | Ridgefield WA Homes for sale | Homes for sale in Vancouver Washington | Washougal WA Real Estate | Yacolt WA Homes | Amboy WA Homes


The information and charts in this Clark County WA real estate update (prepared by Vancouver WA Real Estate Broker, John Slocum, CRS, SFR, our resident statistician) are based on home sales recorded in the Clark County WA MLS system (RMLS), excluding sales of mobile home; and shows the purchase activity since 2009; charting the 3 month Moving average number of sales, and the 12 month Moving average.  This "smoothing" of the trend-data helps illustrate the short-term and longer term trends in Clark County's real estate market.

Disclaimer: as with any real estate statistics, we do our best to provide the best representation at the time the data was acquired and compiled.  The data and reports are deemed reliable but not guaranteed.